 4
4peptides
spectra
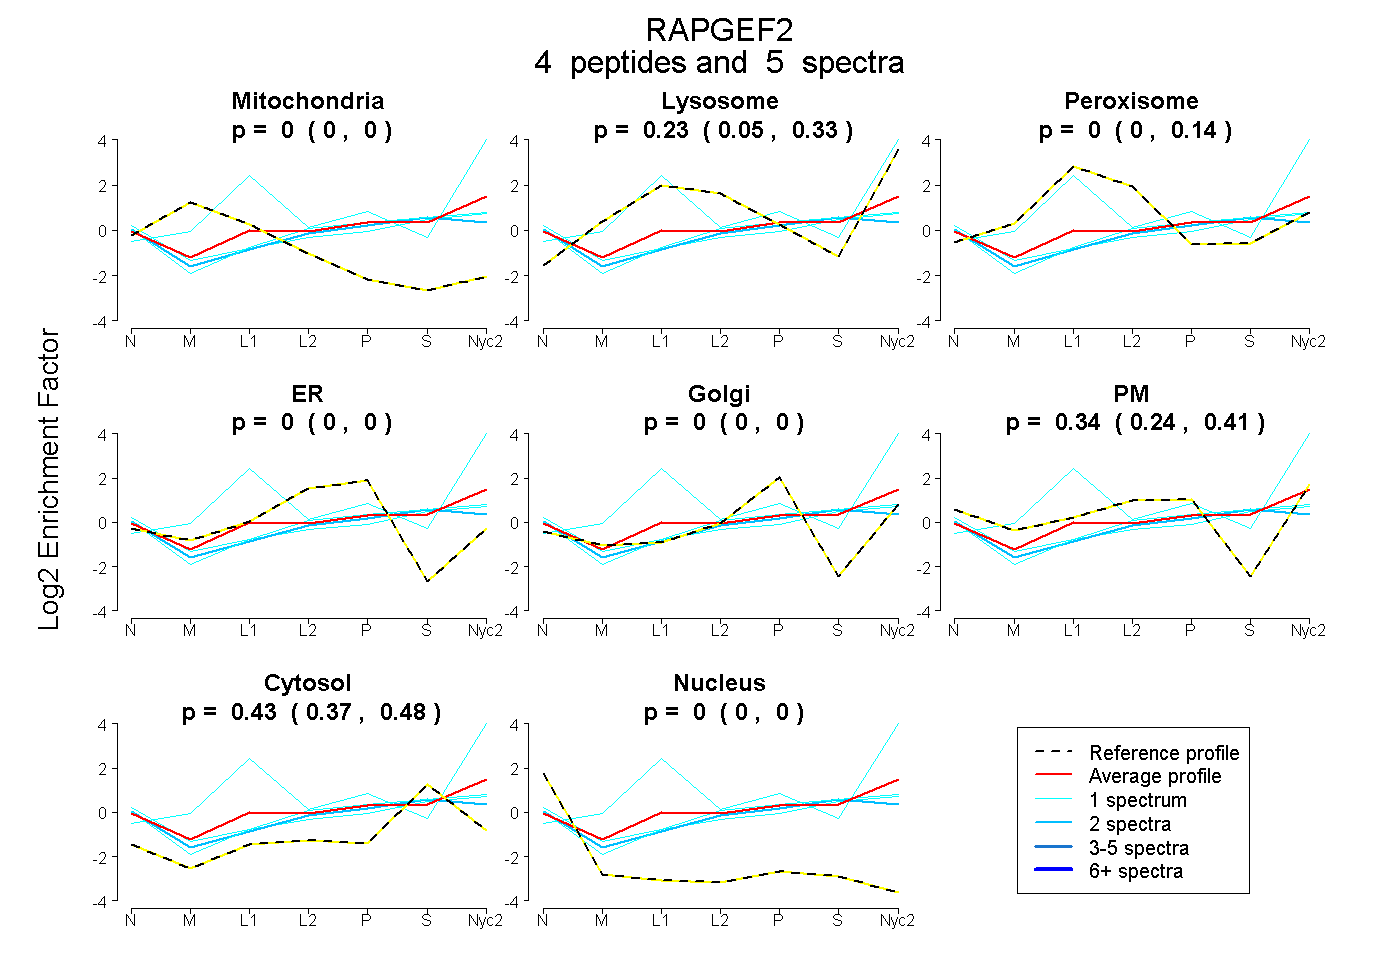
0.000 | 0.000
0.046 | 0.334
0.000 | 0.139
0.000 | 0.000
0.000 | 0.000
0.242 | 0.407
0.370 | 0.476
0.000 | 0.000
| Plot | Mito | Lyso | Perox | ER | Golgi | PM | Cytosol | Nucleus | |||||
| Expt A |
4 peptides |
5 spectra |
|
0.000 0.000 | 0.000 |
0.232 0.046 | 0.334 |
0.000 0.000 | 0.139 |
0.000 0.000 | 0.000 |
0.000 0.000 | 0.000 |
0.336 0.242 | 0.407 |
0.432 0.370 | 0.476 |
0.000 0.000 | 0.000 |
| 1 spectrum, FLEEFENNLER | 0.000 | 0.017 | 0.000 | 0.000 | 0.000 | 0.432 | 0.551 | 0.000 | ||
| 1 spectrum, ATEAGLK | 0.000 | 0.914 | 0.000 | 0.000 | 0.000 | 0.034 | 0.051 | 0.000 | ||
| 2 spectra, NFELFR | 0.000 | 0.000 | 0.000 | 0.000 | 0.000 | 0.421 | 0.579 | 0.000 | ||
| 1 spectrum, NIEPTEYIDDLFK | 0.000 | 0.028 | 0.000 | 0.000 | 0.000 | 0.426 | 0.546 | 0.000 |
| Plot | Lyso | Other | |||||||||||
| Expt C |
3 peptides |
5 spectra |
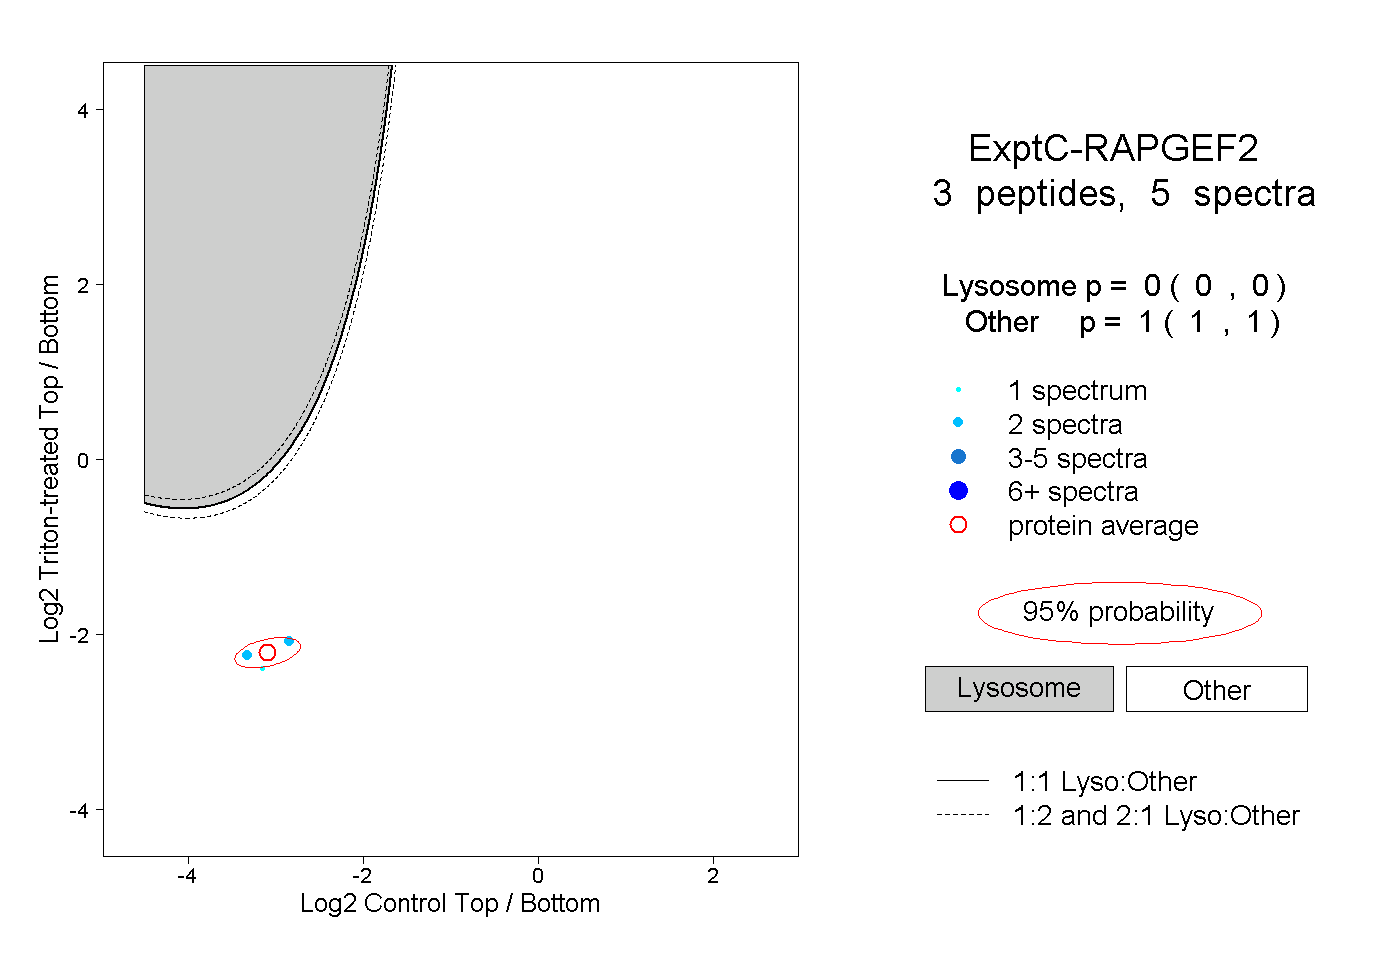 |
0.000 0.000 | 0.000 |
1.000 1.000 | 1.000 |