 7
7peptides
spectra
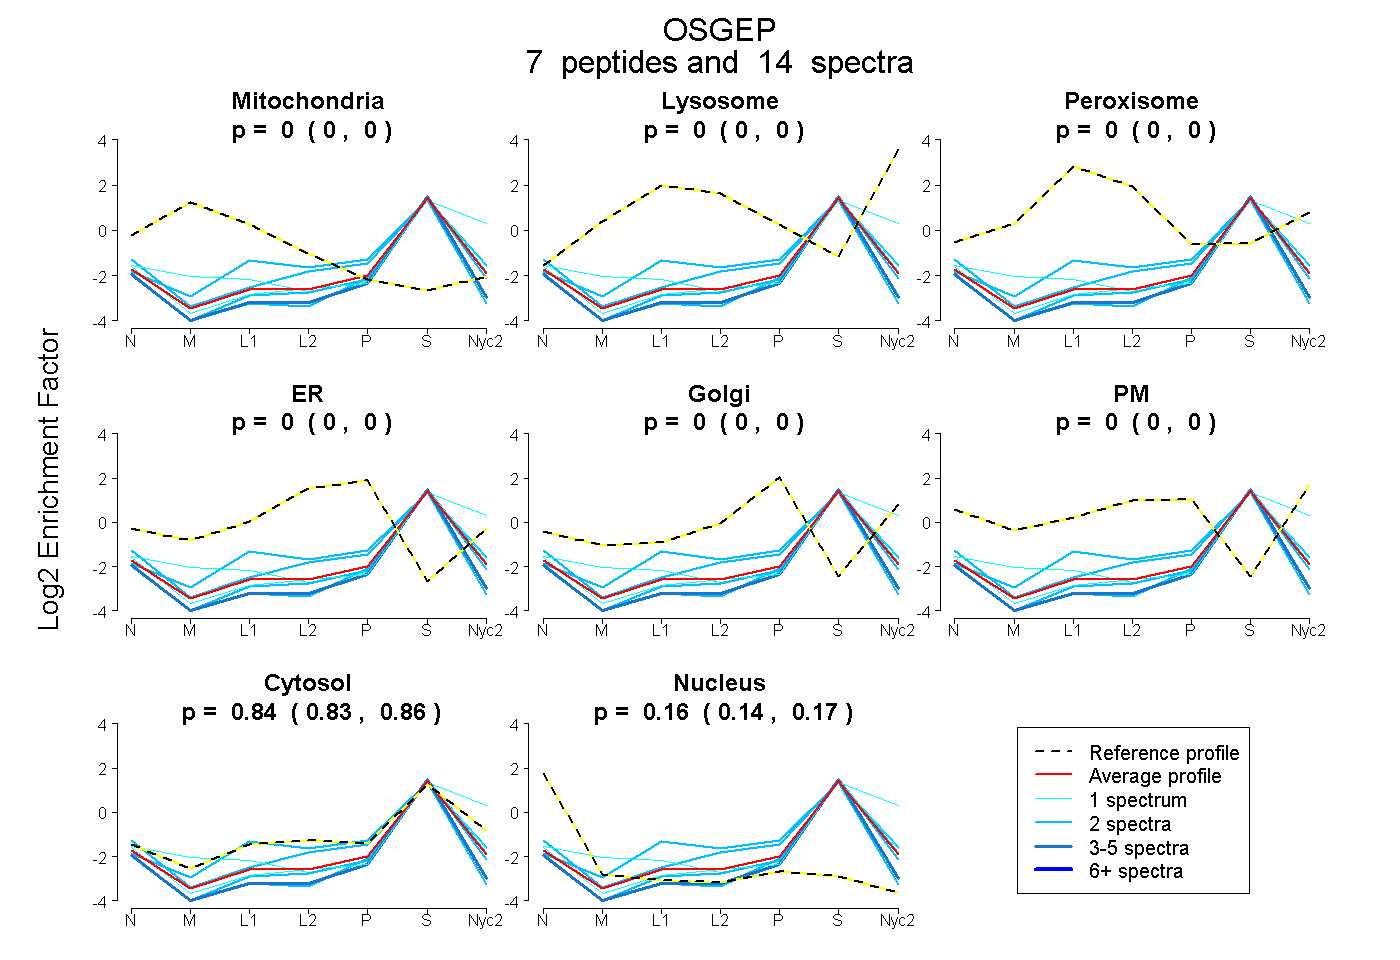
0.000 | 0.000
0.000 | 0.000
0.000 | 0.000
0.000 | 0.000
0.000 | 0.000
0.000 | 0.000
0.826 | 0.858
0.140 | 0.171
3peptides
spectra
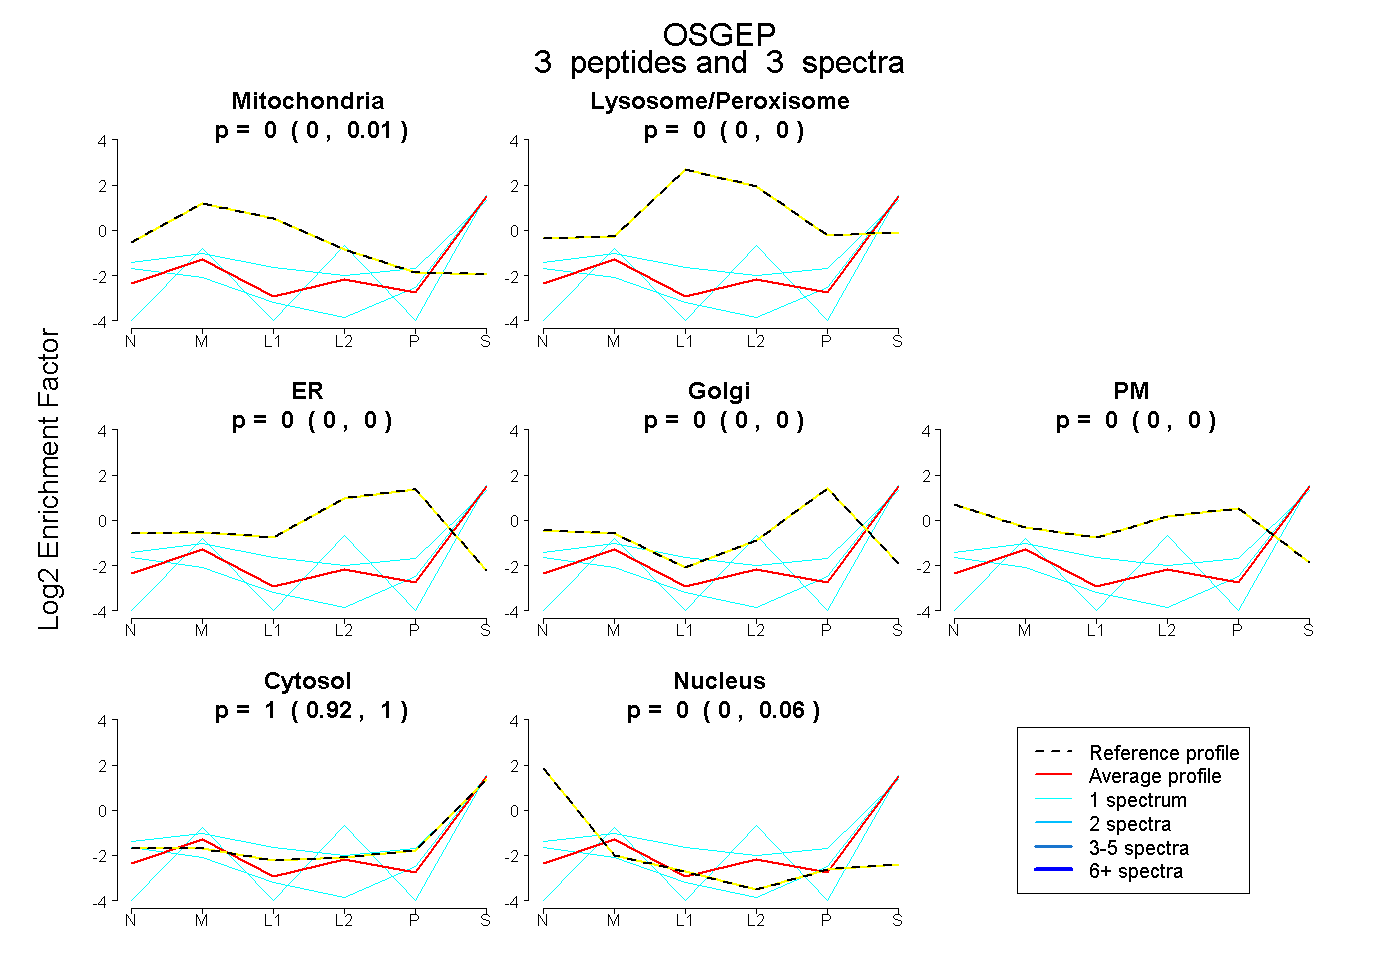
0.000 | 0.007
0.000 | 0.000
0.000 | 0.000
0.000 | 0.000
0.000 | 0.000
0.918 | 1.000
0.000 | 0.055
2peptides
spectra
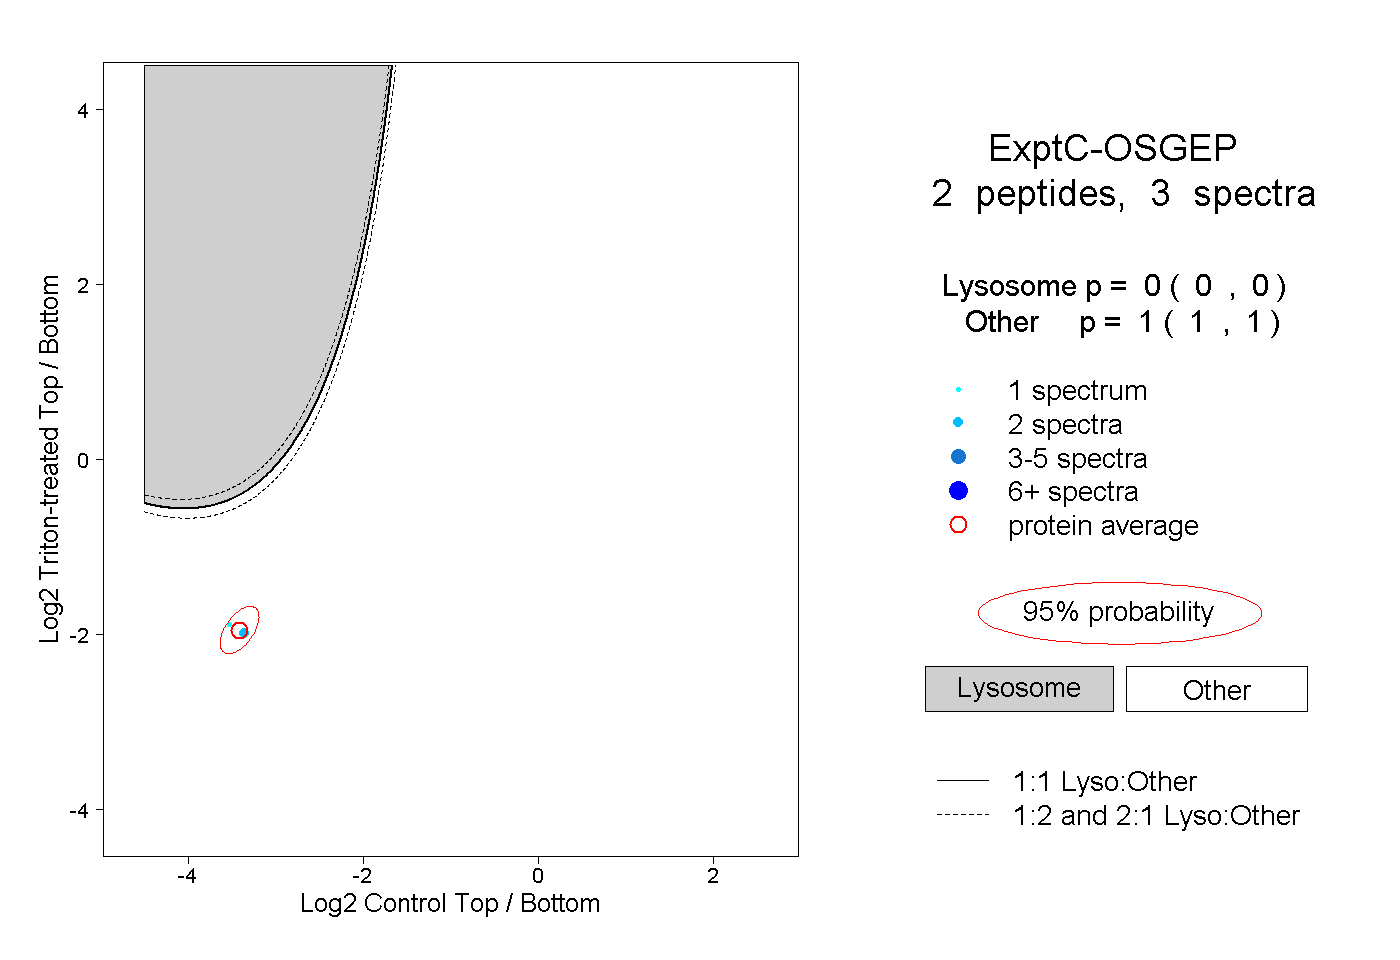
0.000 | 0.000
1.000 | 1.000