 5
5peptides
spectra
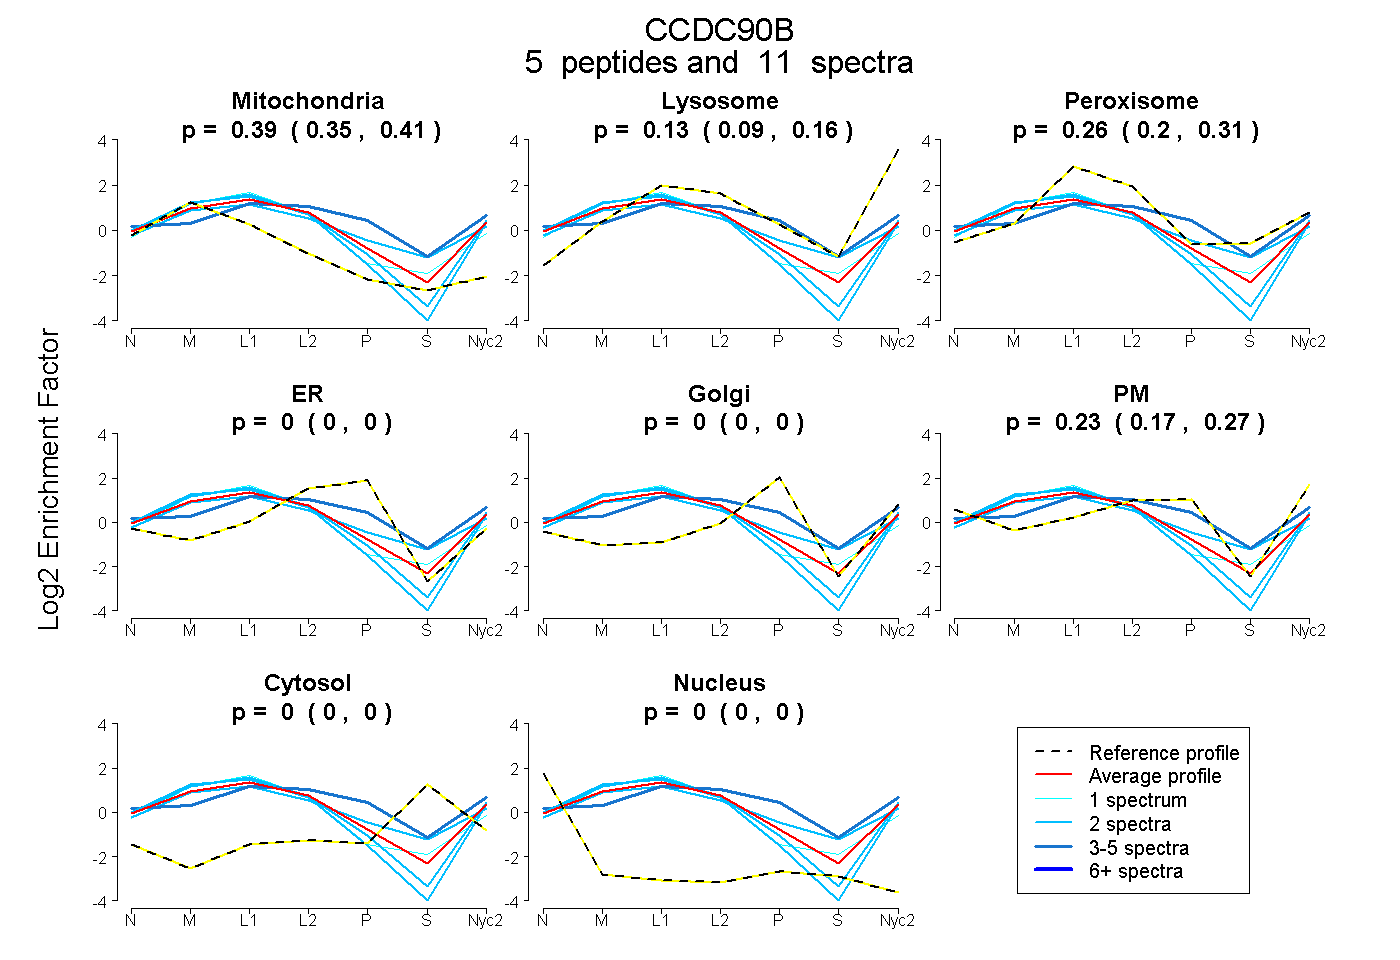
0.350 | 0.414
0.090 | 0.158
0.199 | 0.315
0.000 | 0.000
0.000 | 0.000
0.171 | 0.267
0.000 | 0.000
0.000 | 0.000
2peptides
spectra
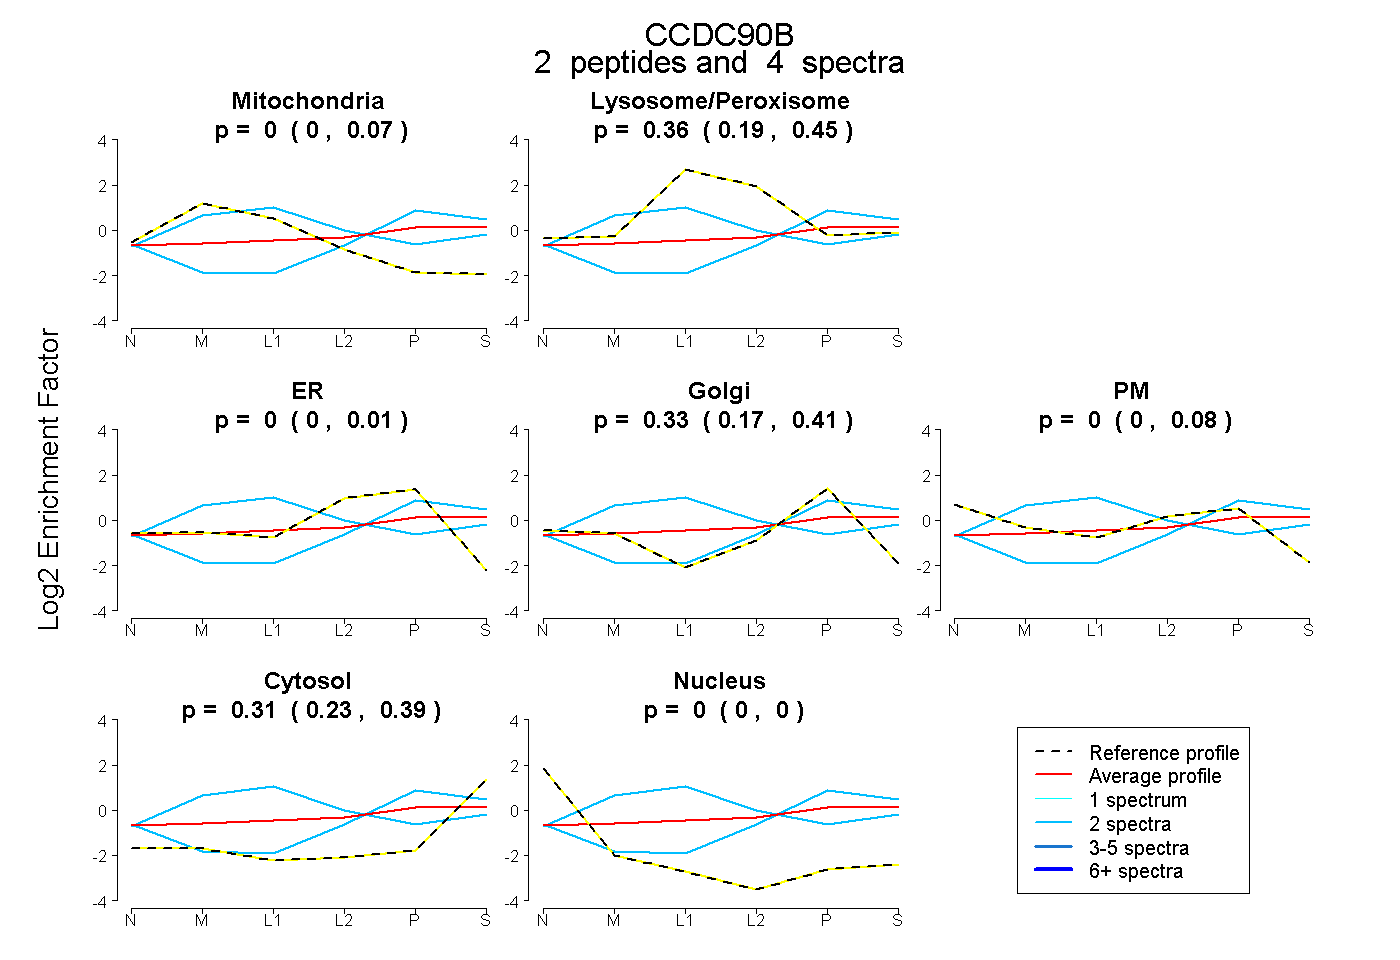
0.000 | 0.071
0.193 | 0.451
0.000 | 0.011
0.166 | 0.410
0.000 | 0.077
0.225 | 0.387
0.000 | 0.000
11peptides
spectra
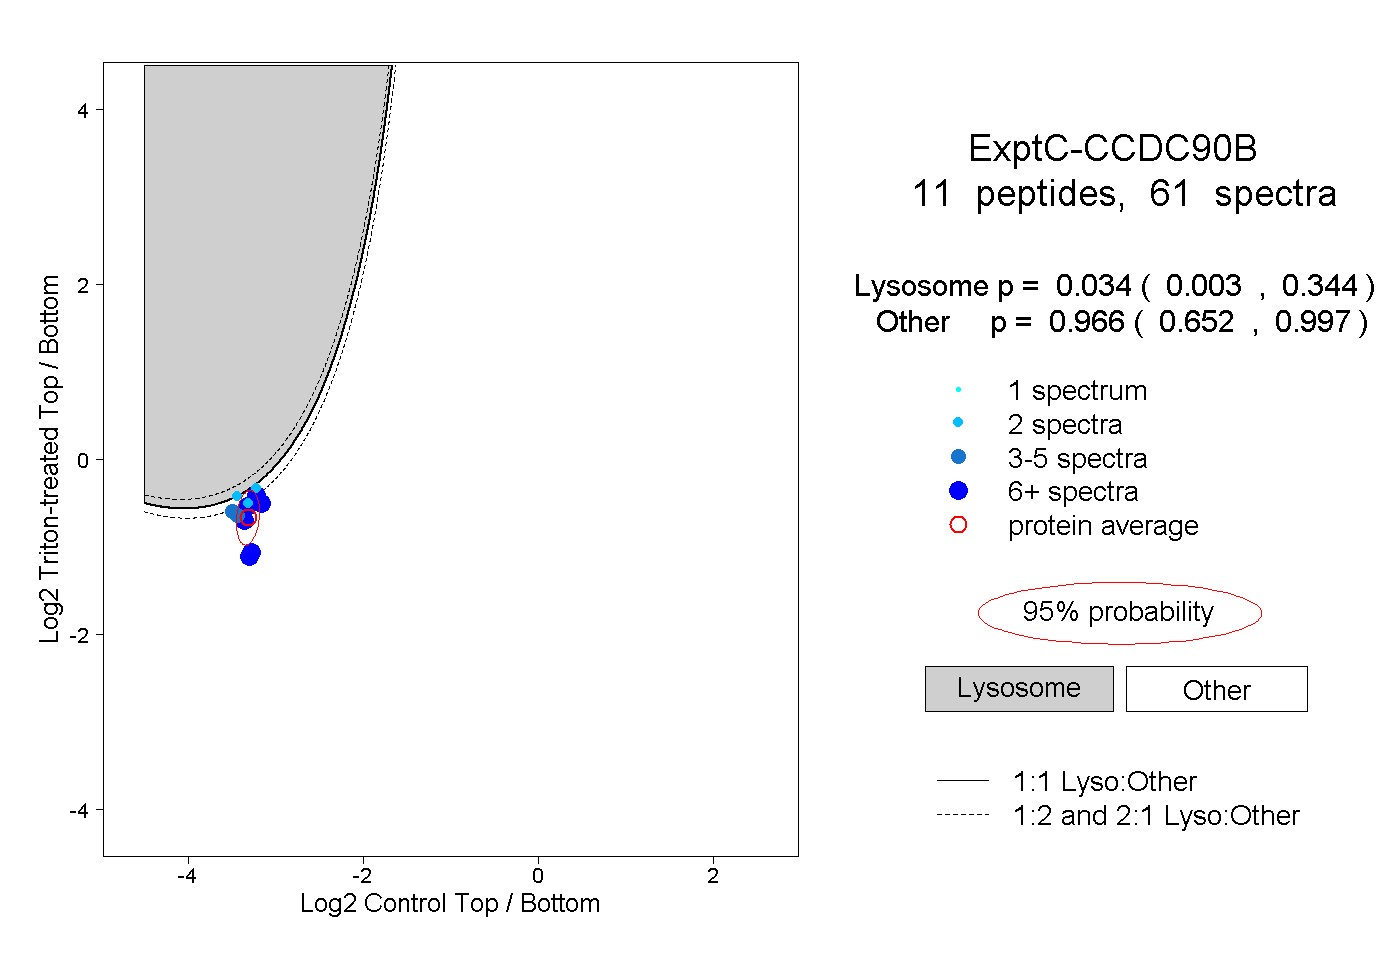
0.003 | 0.344
0.652 | 0.997
4peptides
spectra
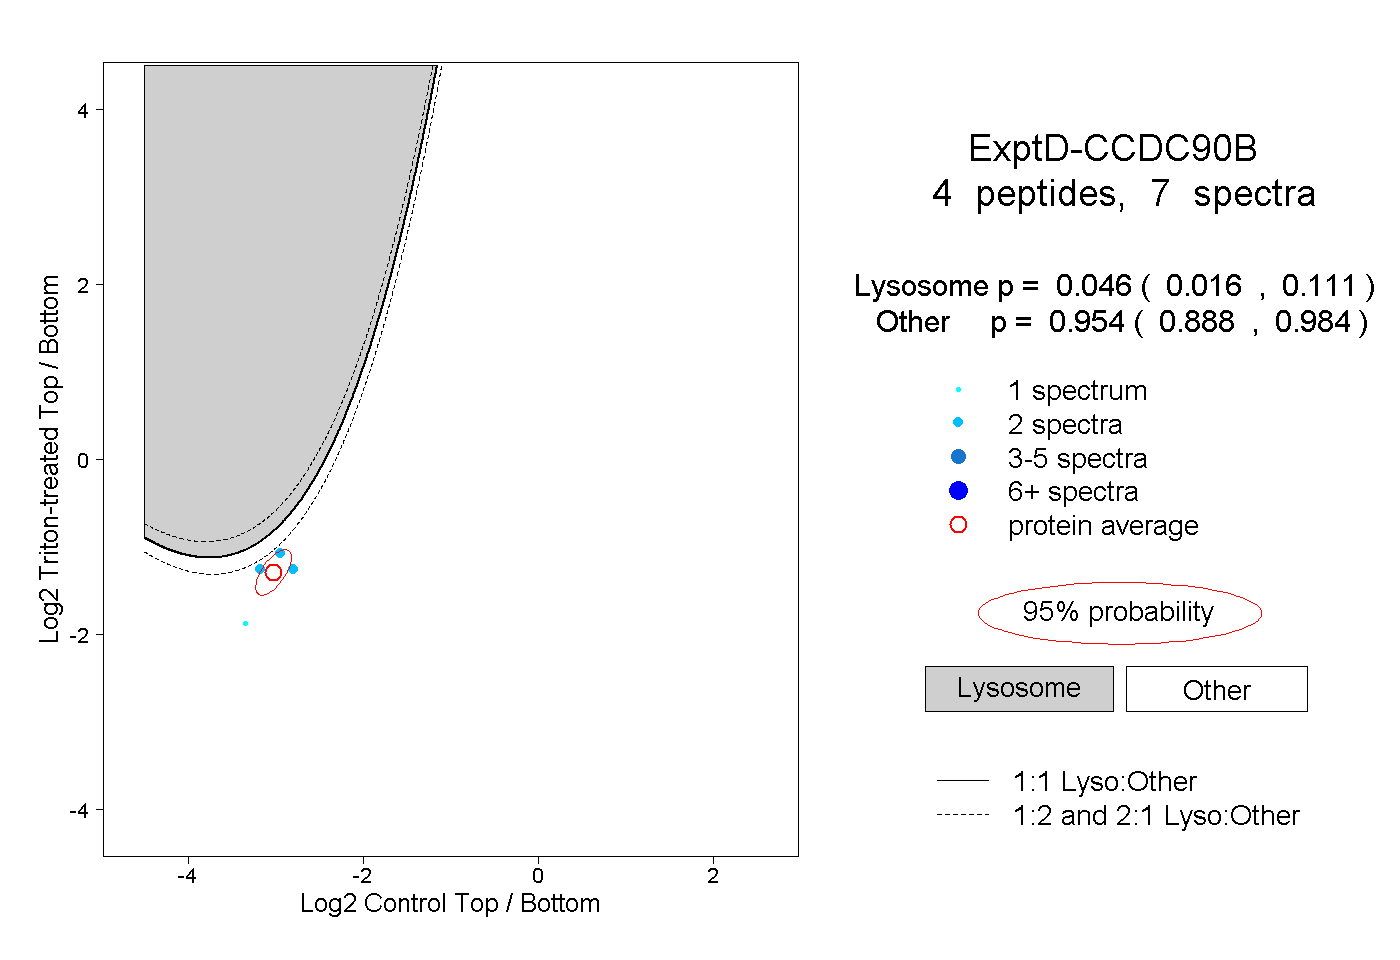
0.016 | 0.111
0.888 | 0.984