17
17peptides
spectra
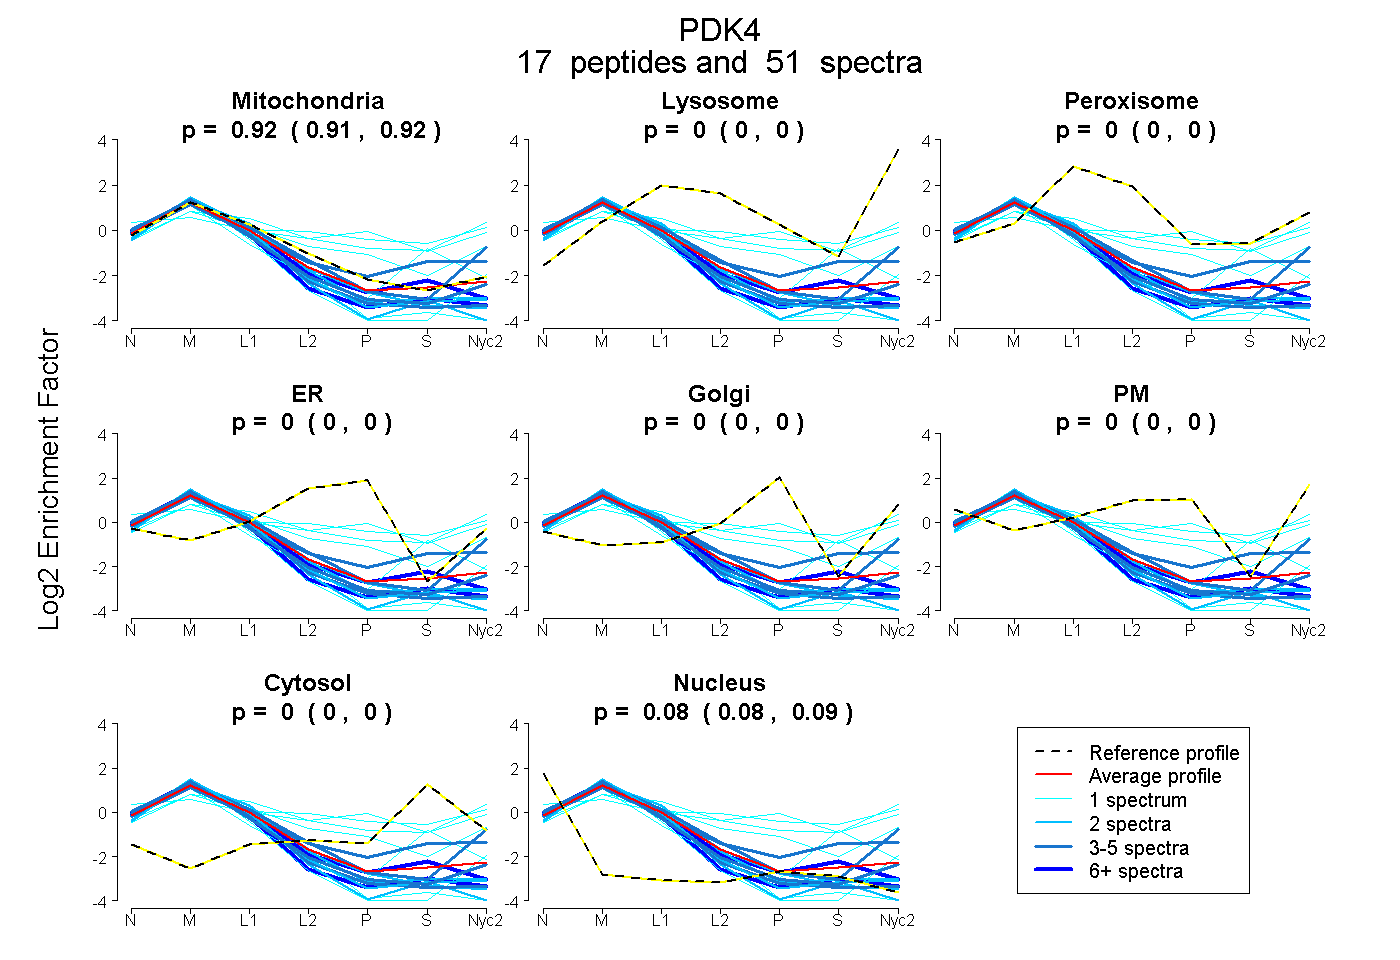
0.913 | 0.922
0.000 | 0.000
0.000 | 0.000
0.000 | 0.000
0.000 | 0.000
0.000 | 0.000
0.000 | 0.000
0.077 | 0.086
8peptides
spectra
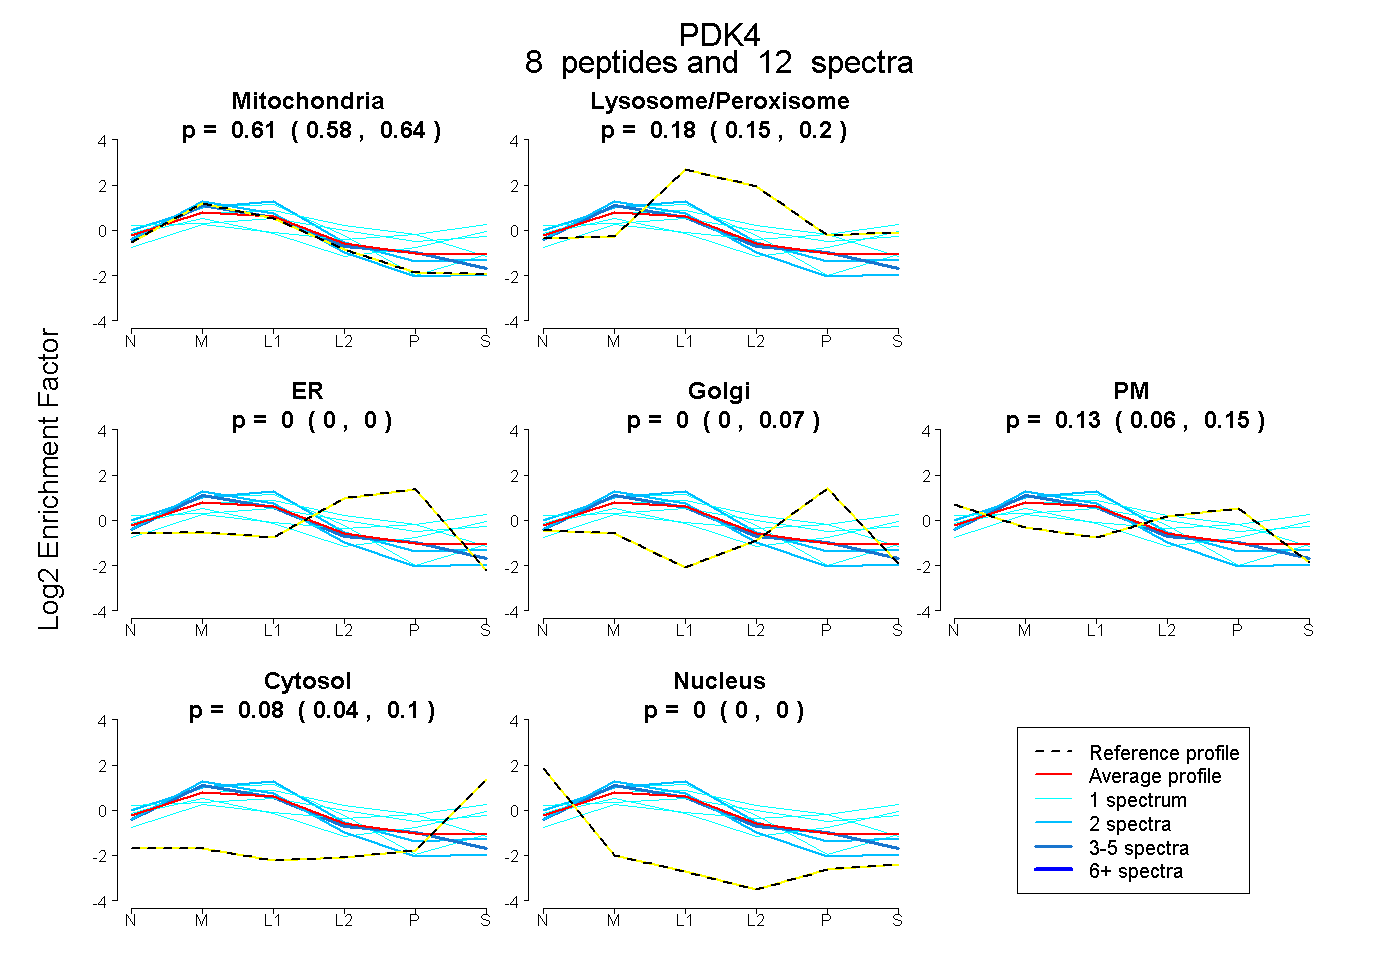
0.577 | 0.645
0.150 | 0.204
0.000 | 0.000
0.000 | 0.067
0.060 | 0.150
0.044 | 0.097
0.000 | 0.000