 3
3peptides
spectra
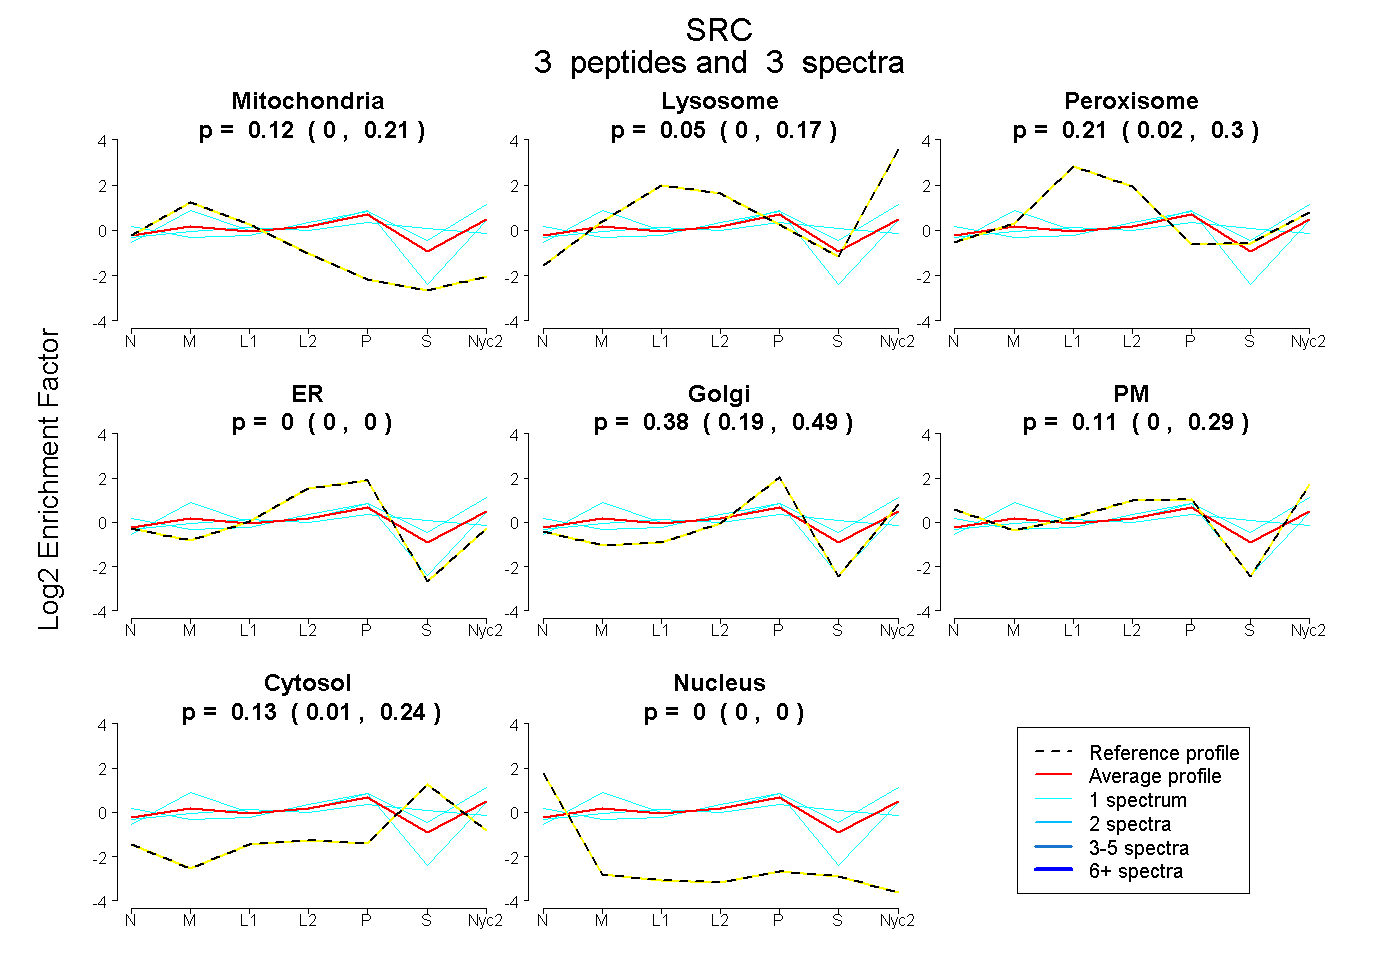
0.004 | 0.212
0.000 | 0.173
0.019 | 0.304
0.000 | 0.000
0.194 | 0.493
0.000 | 0.286
0.011 | 0.240
0.000 | 0.000
3peptides
spectra
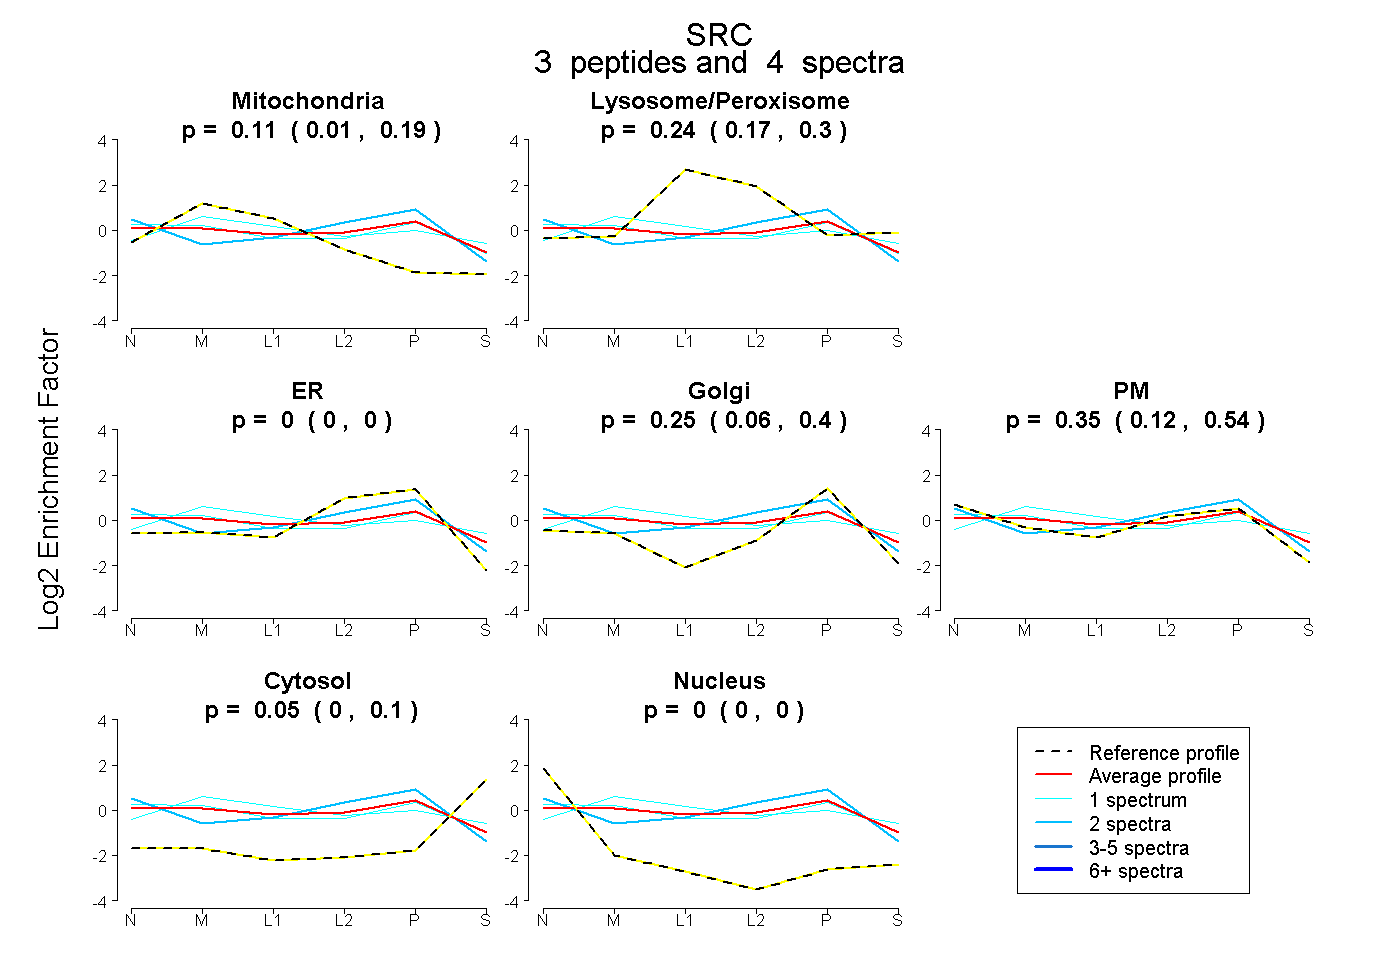
0.011 | 0.189
0.167 | 0.301
0.000 | 0.000
0.062 | 0.399
0.118 | 0.544
0.000 | 0.100
0.000 | 0.000
2peptides
spectra
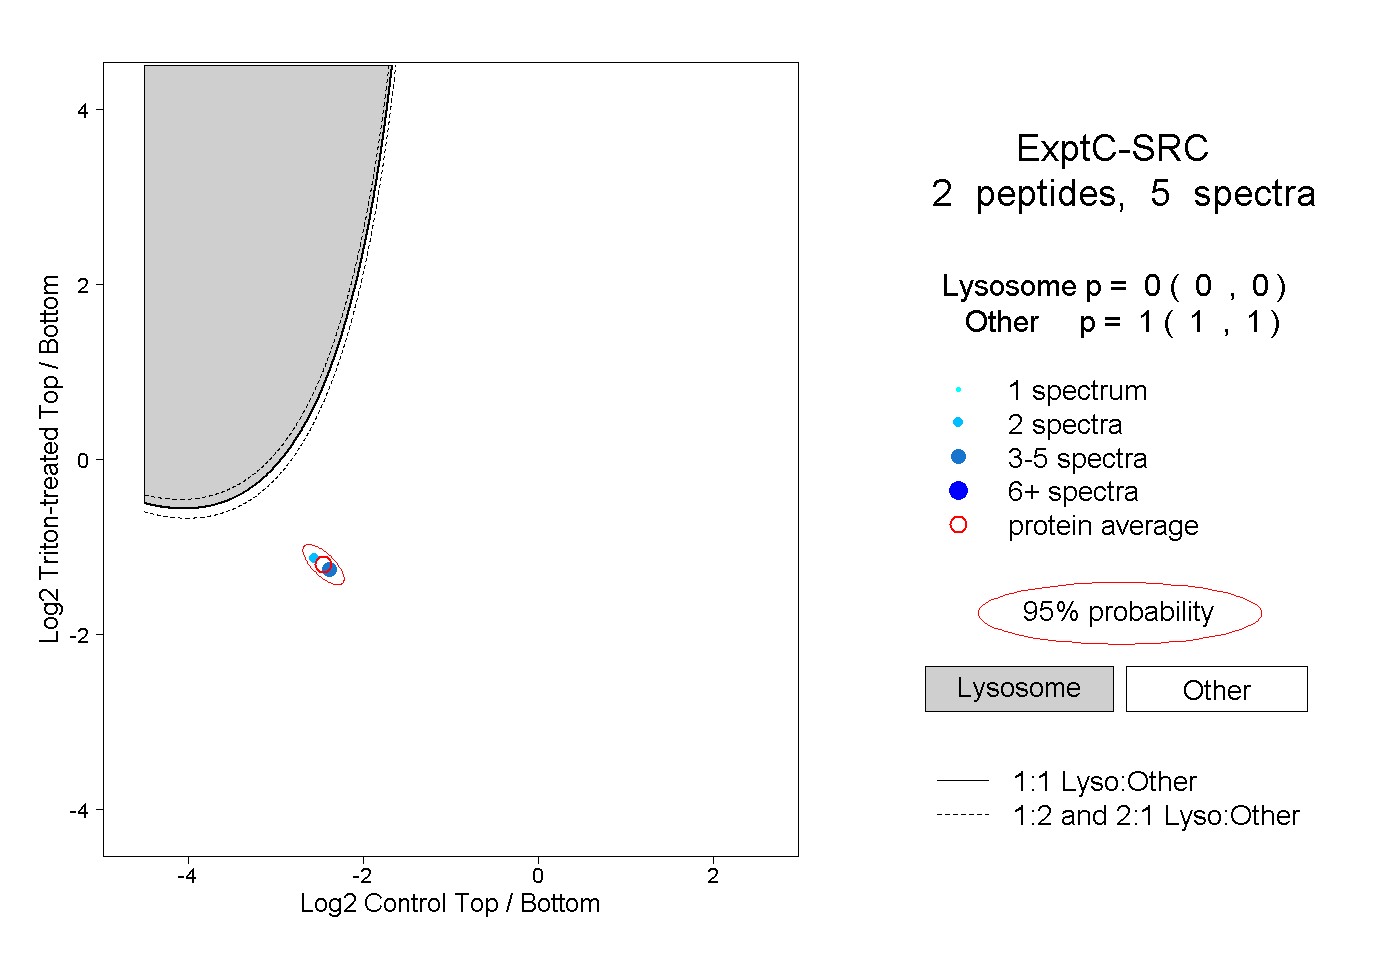
0.000 | 0.000
1.000 | 1.000