 9
9peptides
spectra
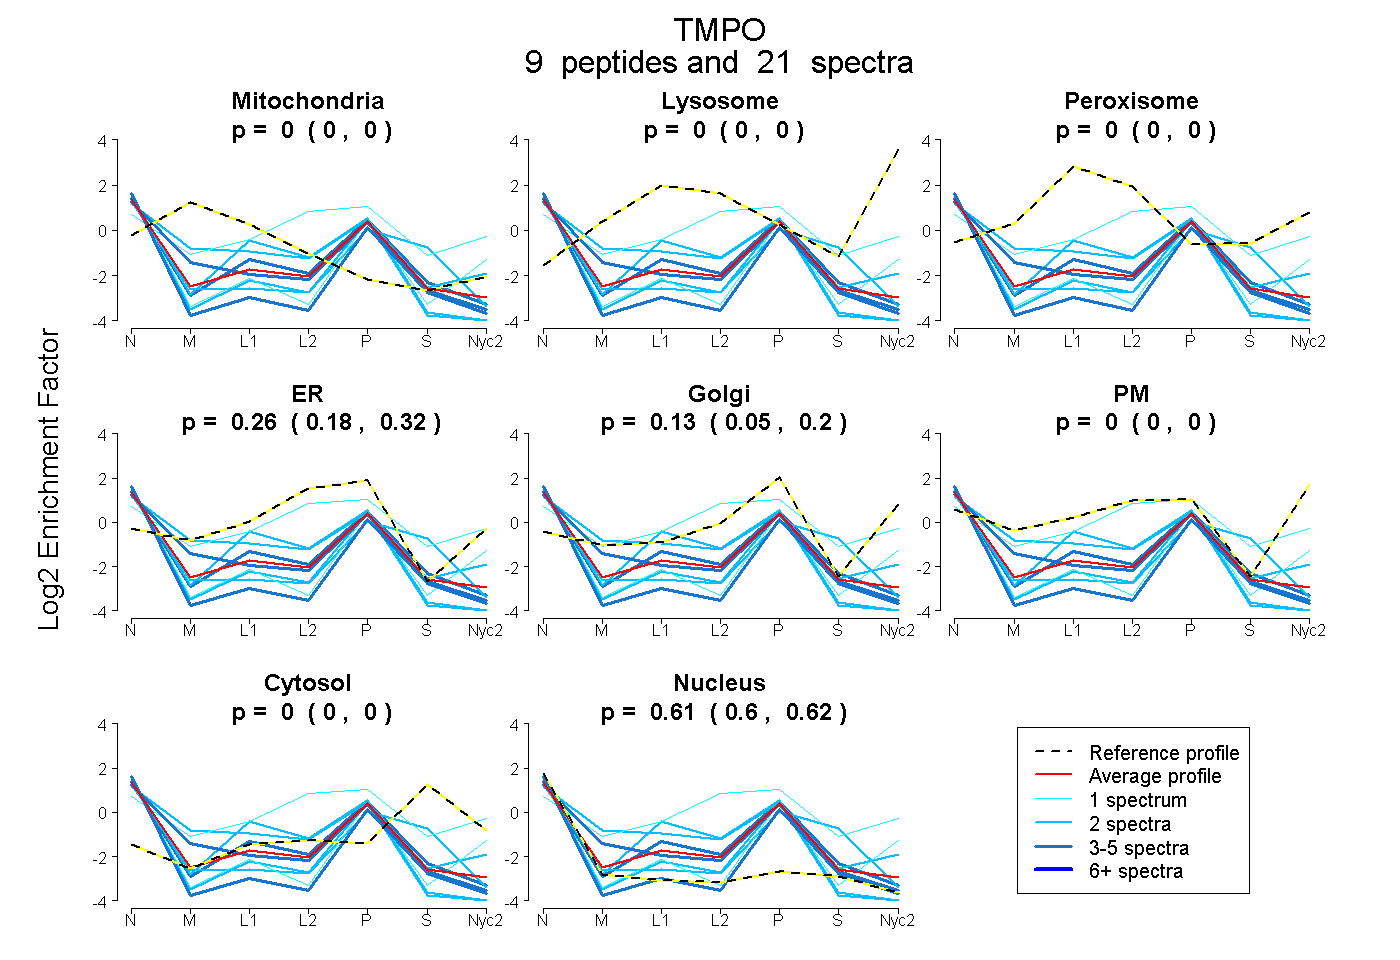
0.000 | 0.000
0.000 | 0.000
0.000 | 0.000
0.182 | 0.323
0.053 | 0.196
0.000 | 0.000
0.000 | 0.000
0.596 | 0.624
5peptides
spectra
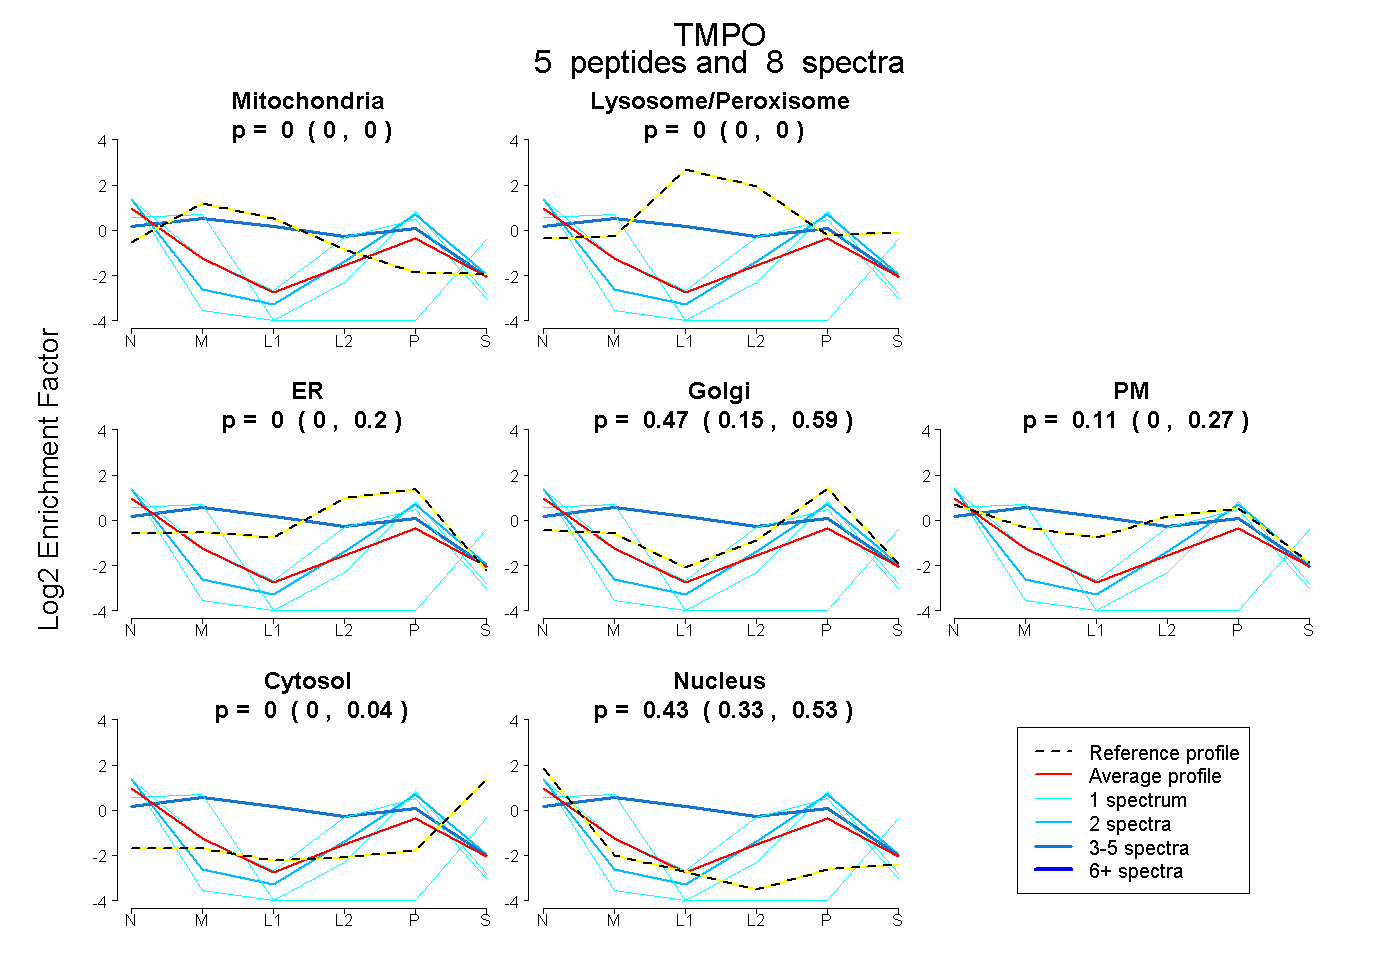
0.000 | 0.000
0.000 | 0.000
0.000 | 0.200
0.148 | 0.592
0.000 | 0.273
0.000 | 0.038
0.335 | 0.526
2peptides
spectra
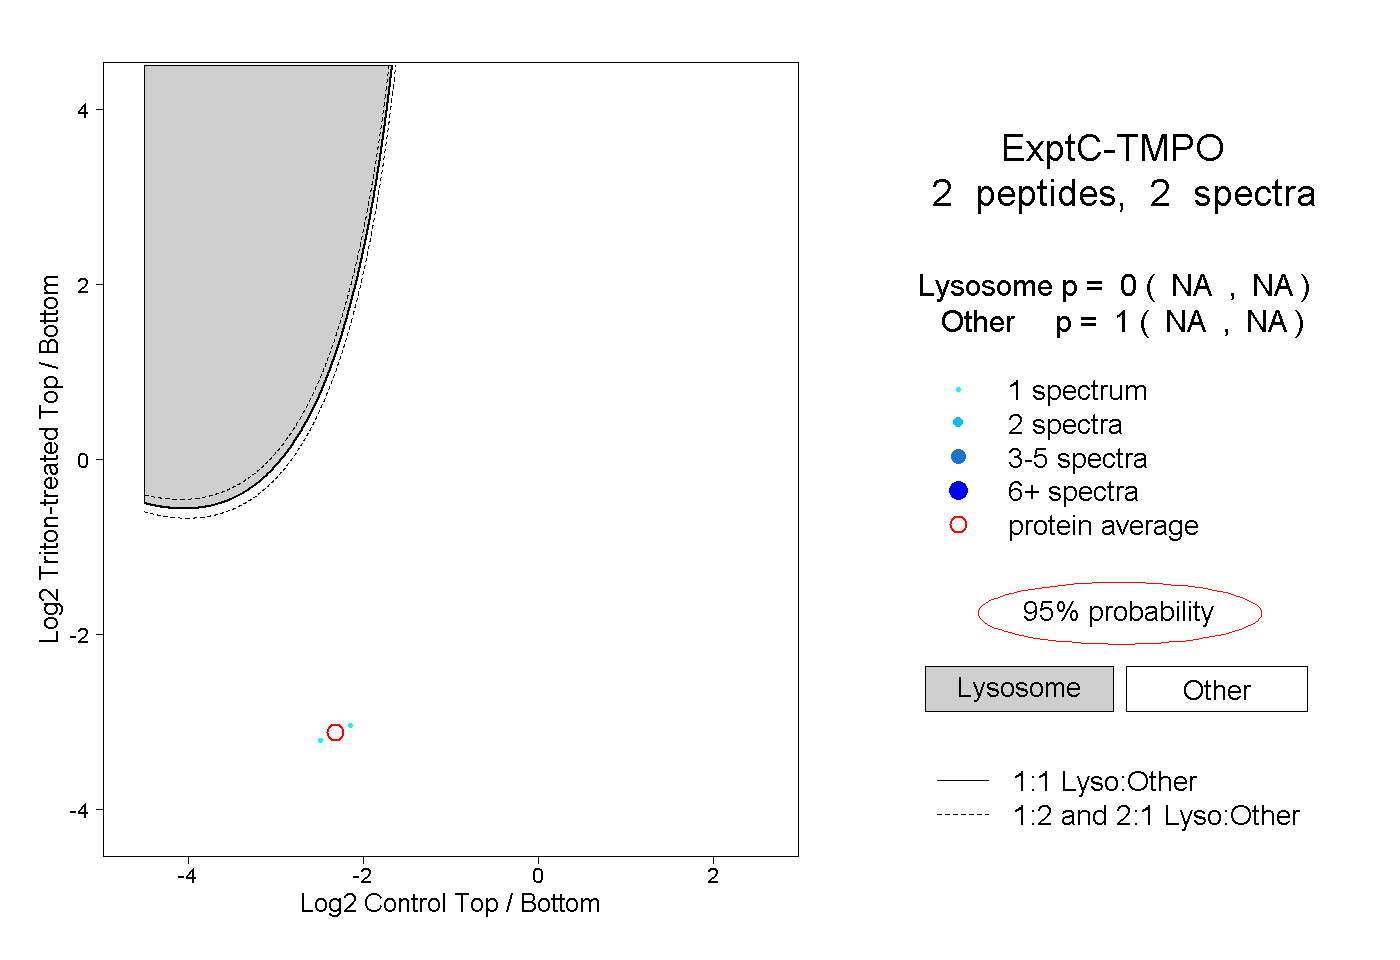
NA | NA
NA | NA
2peptides
spectra
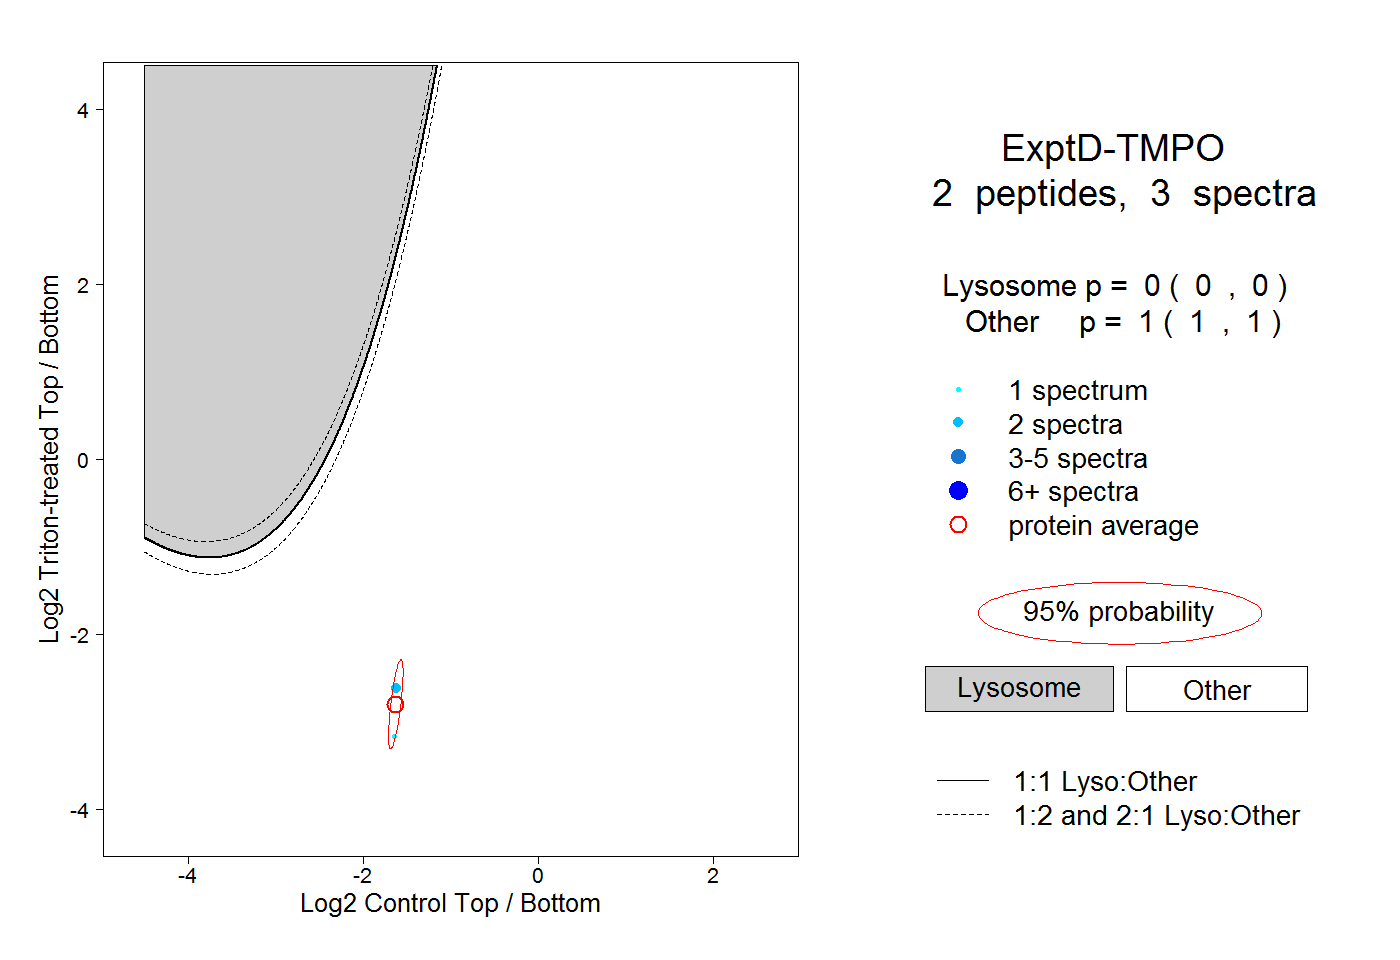
0.000 | 0.000
1.000 | 1.000