 2
2peptides
spectra
0.000 | 0.000
0.000 | 0.000
0.000 | 0.051
0.000 | 0.451
0.000 | 0.617
0.000 | 0.303
0.113 | 0.197
0.086 | 0.396
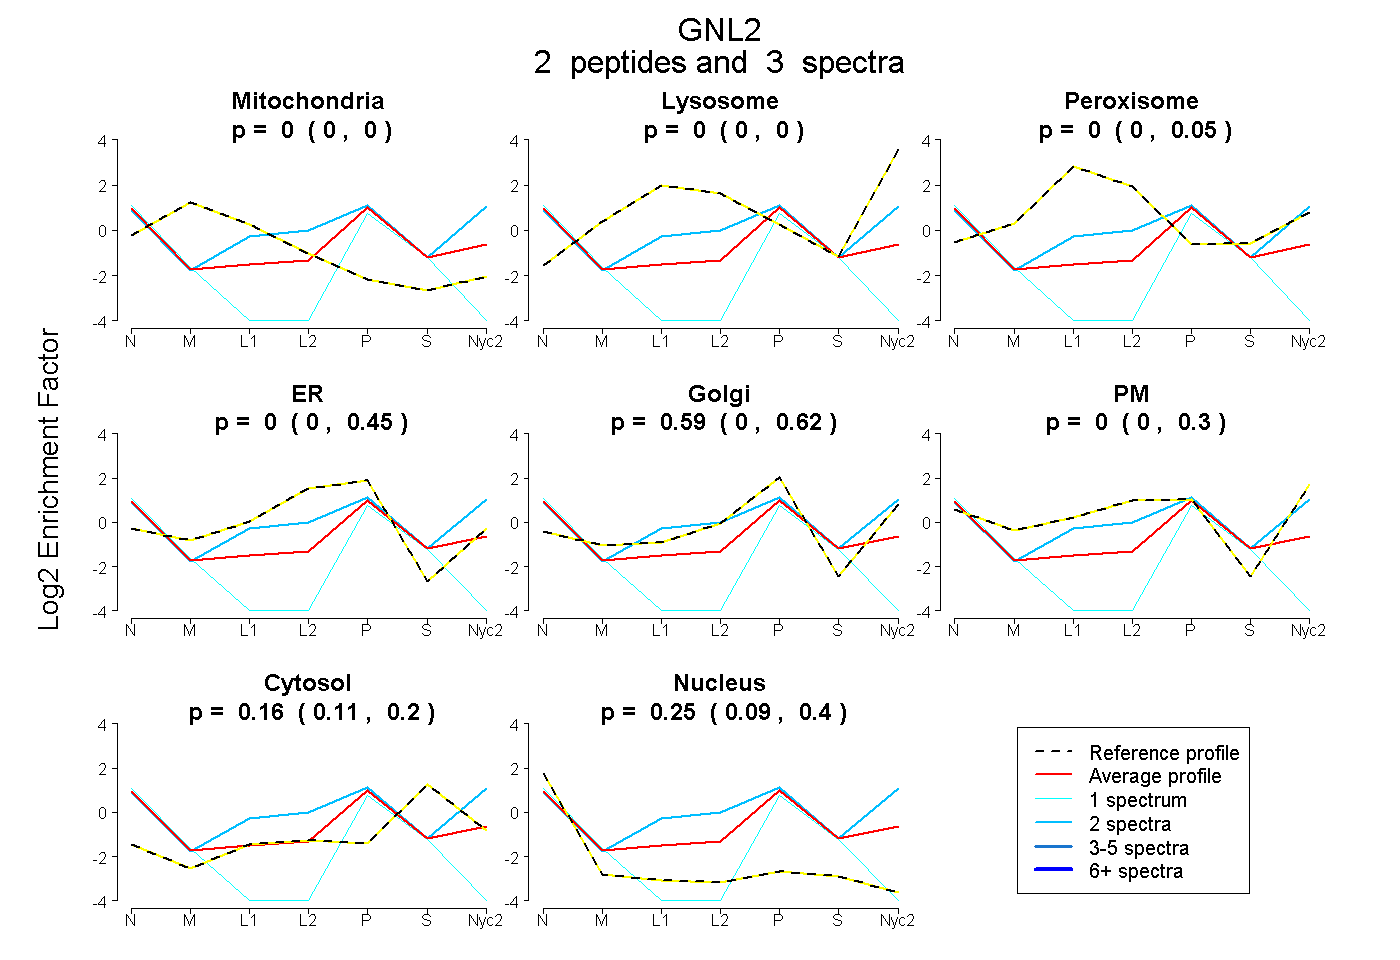
| Plot | Mito | Lyso | Perox | ER | Golgi | PM | Cytosol | Nucleus | |||||
| Expt A |
2 peptides |
3 spectra |
|
0.000 0.000 | 0.000 |
0.000 0.000 | 0.000 |
0.000 0.000 | 0.051 |
0.000 0.000 | 0.451 |
0.593 0.000 | 0.617 |
0.000 0.000 | 0.303 |
0.161 0.113 | 0.197 |
0.246 0.086 | 0.396 |
| 1 spectrum, IESWENAEDFLEK | 0.000 | 0.000 | 0.000 | 0.000 | 0.179 | 0.000 | 0.069 | 0.752 | ||
| 2 spectra, GAFIQLLR | 0.000 | 0.000 | 0.000 | 0.000 | 0.171 | 0.586 | 0.218 | 0.025 |