 5
5peptides
spectra
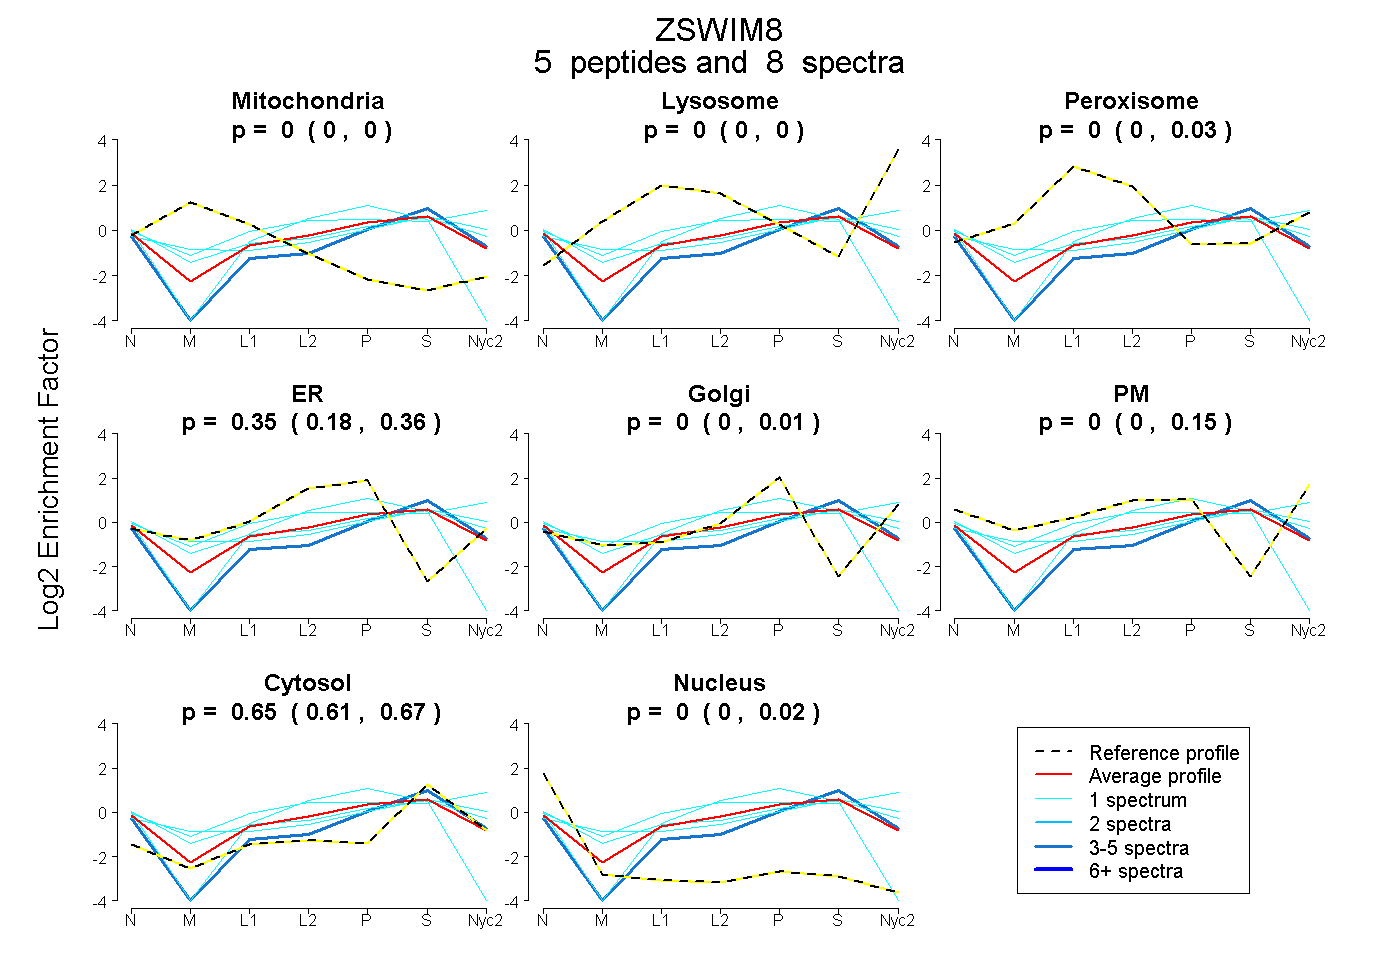
0.000 | 0.000
0.000 | 0.000
0.000 | 0.032
0.180 | 0.364
0.000 | 0.007
0.000 | 0.153
0.607 | 0.668
0.000 | 0.018
1peptide
spectrum
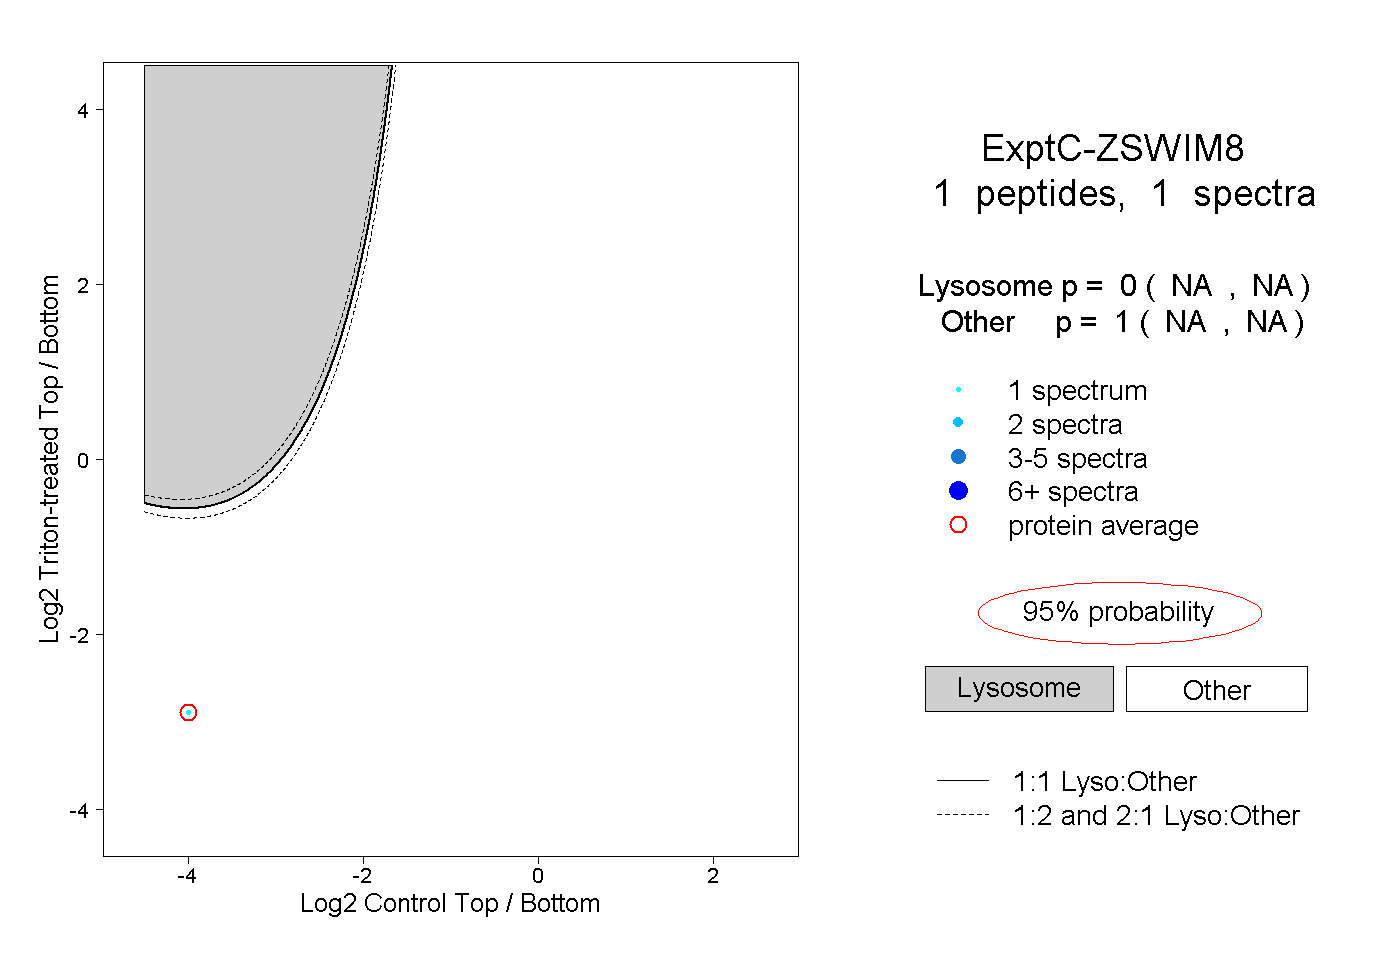
NA | NA
NA | NA
| Plot | Mito | Lyso | Perox | ER | Golgi | PM | Cytosol | Nucleus | |||||
| Expt A |
5 peptides |
8 spectra |
|
0.000 0.000 | 0.000 |
0.000 0.000 | 0.000 |
0.000 0.000 | 0.032 |
0.353 0.180 | 0.364 |
0.000 0.000 | 0.007 |
0.000 0.000 | 0.153 |
0.647 0.607 | 0.668 |
0.000 0.000 | 0.018 |
||
| Plot | Lyso | Other | |||||||||||
| Expt C |
1 peptide |
1 spectrum |
|
0.000 NA | NA |
1.000 NA | NA |