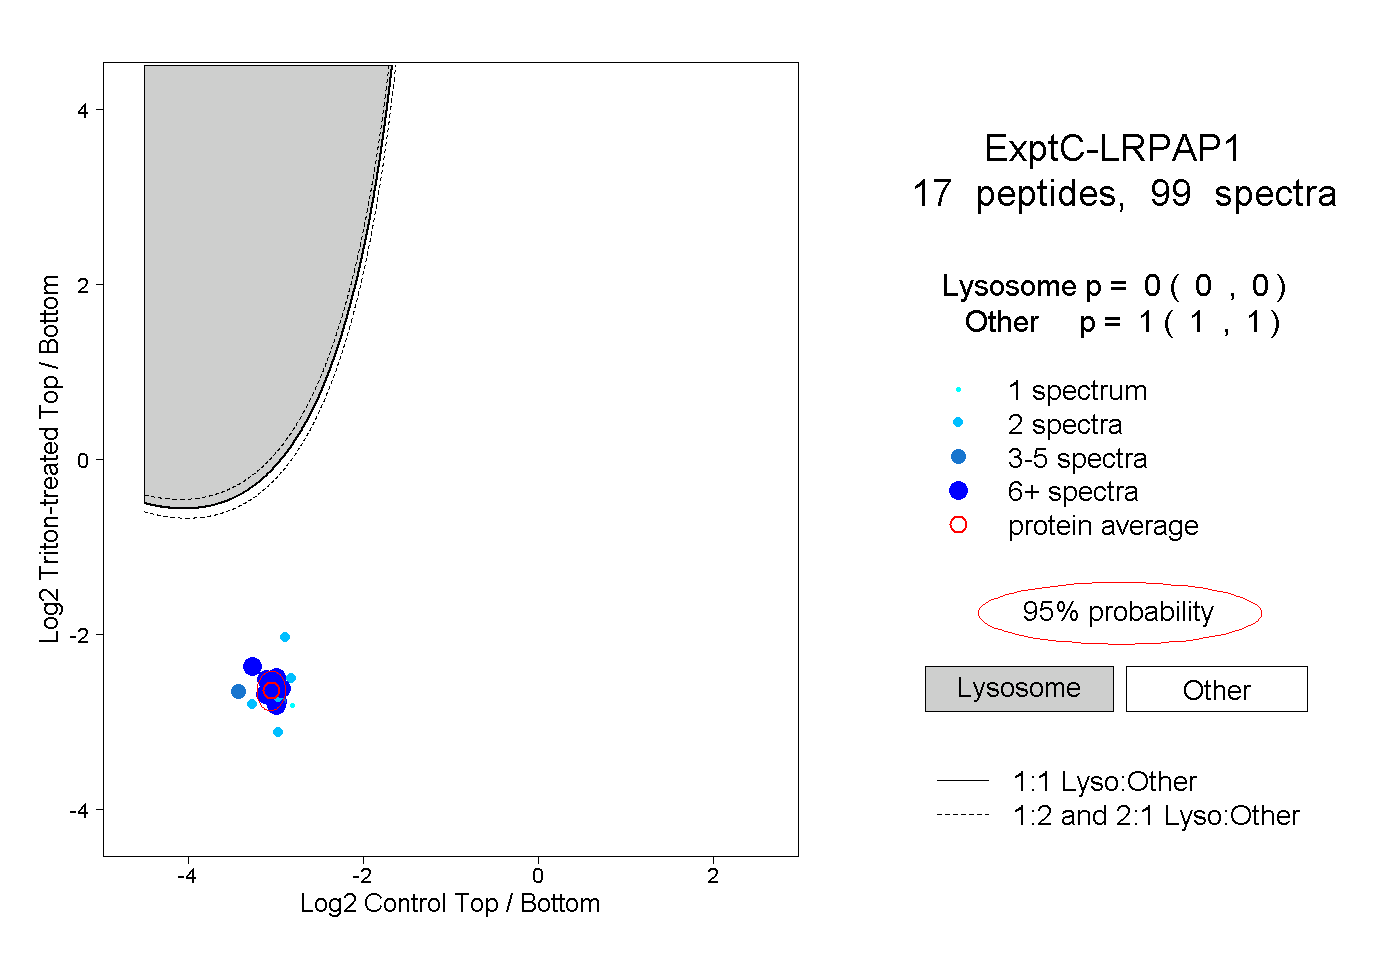
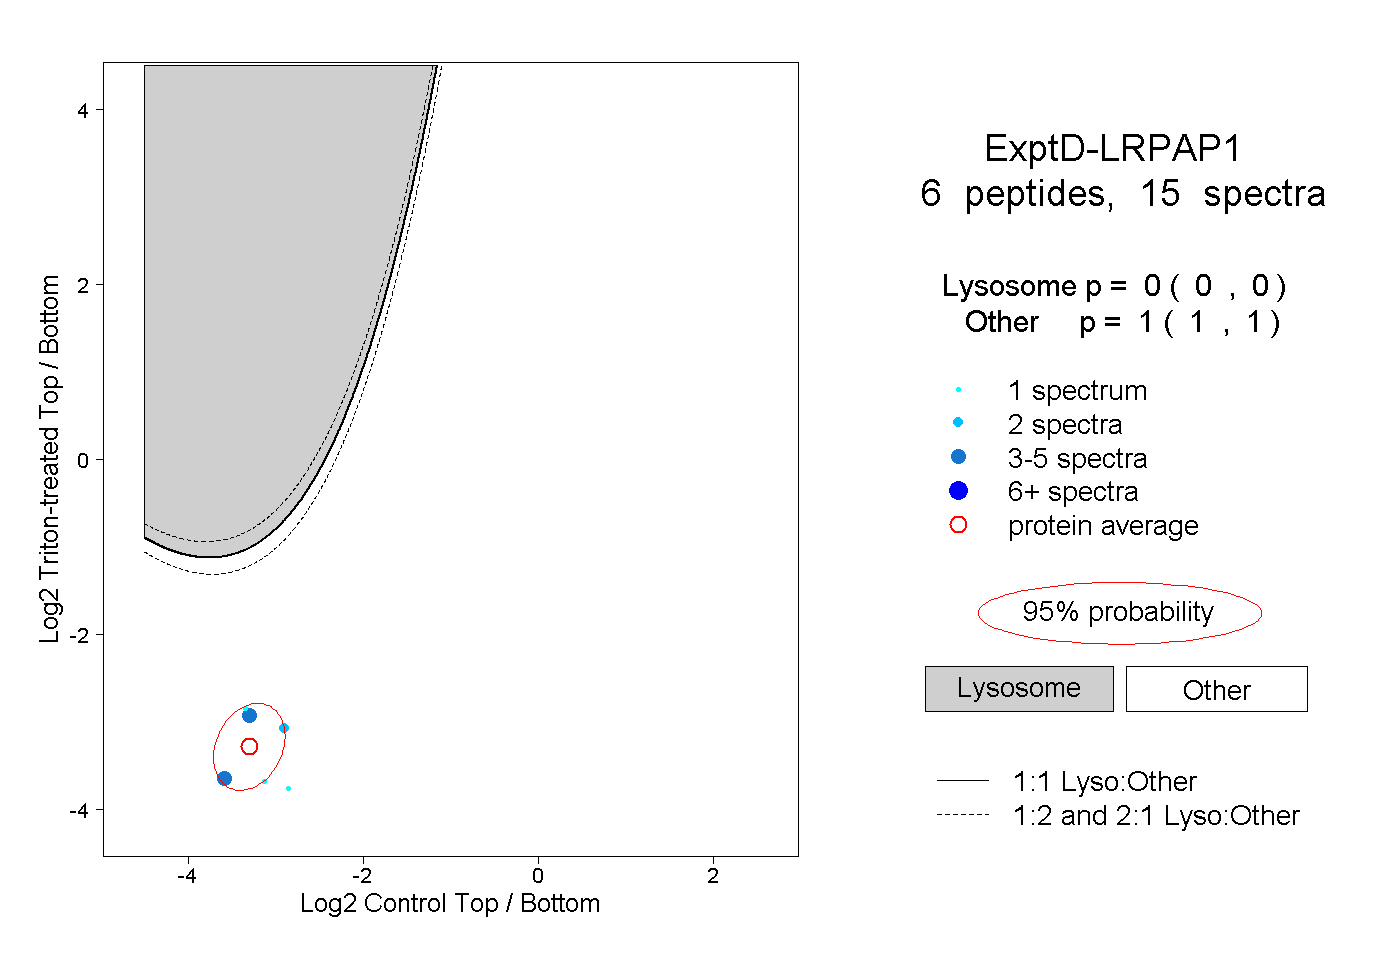
17
17peptides
spectra
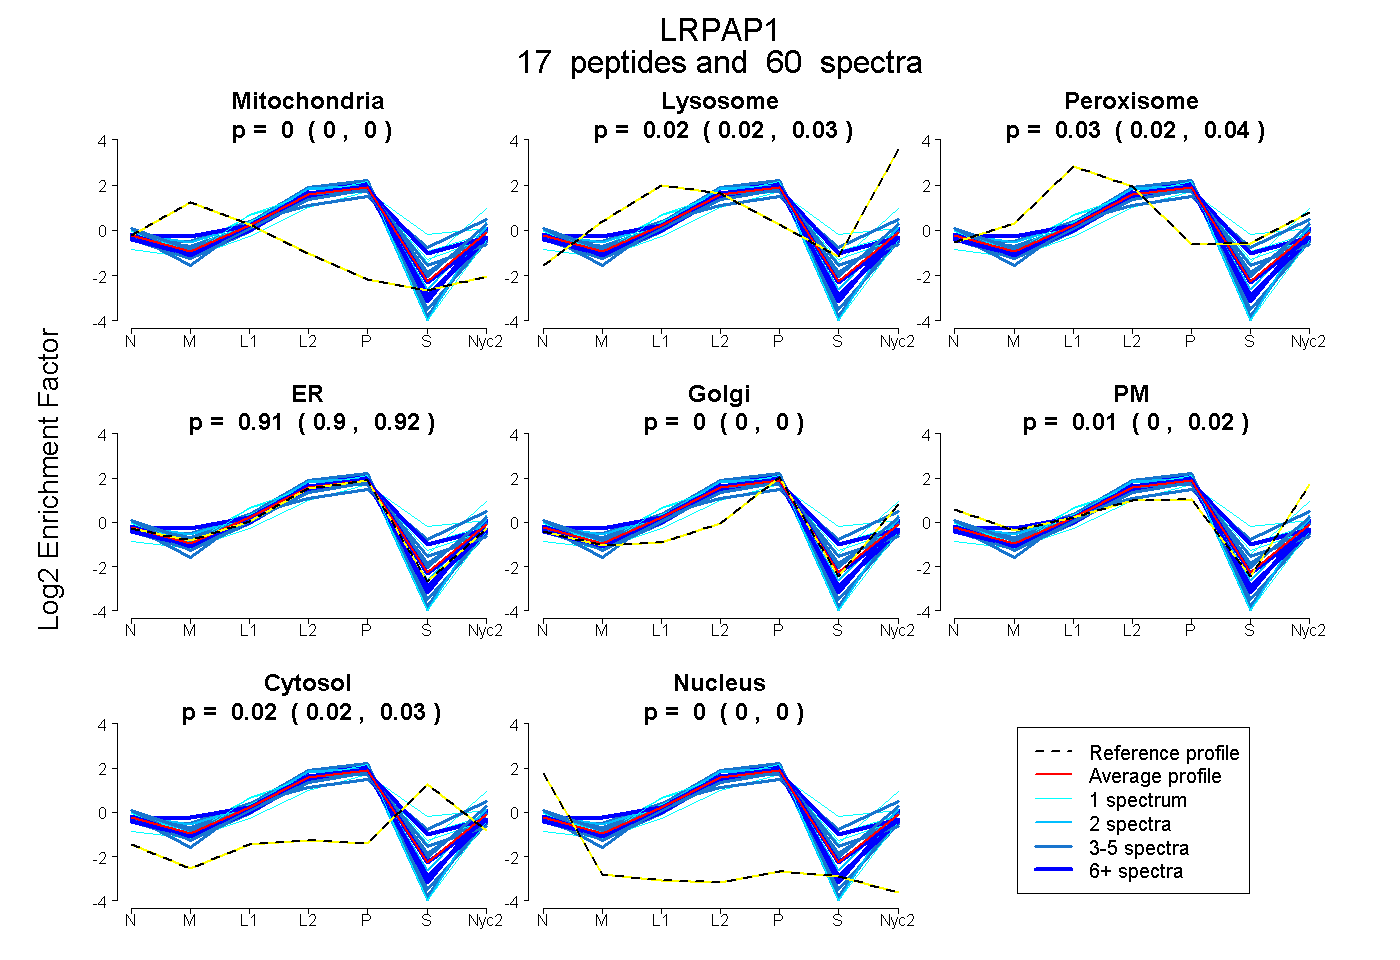
0.000 | 0.000
0.017 | 0.030
0.024 | 0.038
0.901 | 0.917
0.000 | 0.000
0.001 | 0.020
0.017 | 0.028
0.000 | 0.000
10peptides
spectra
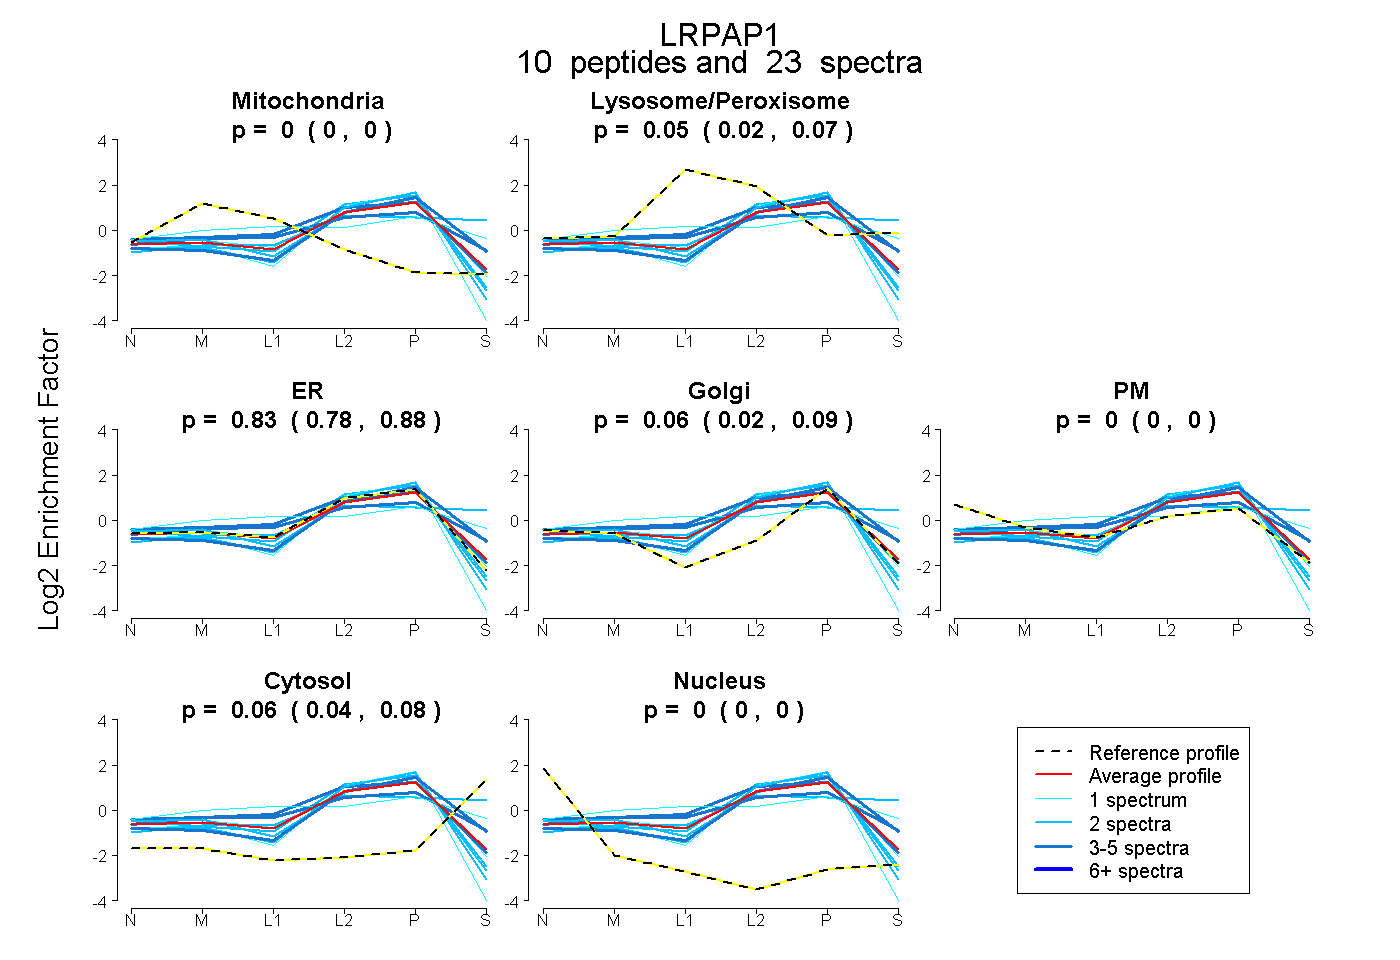
0.000 | 0.000
0.023 | 0.071
0.778 | 0.877
0.023 | 0.090
0.000 | 0.000
0.039 | 0.075
0.000 | 0.000