 2
2peptides
spectra
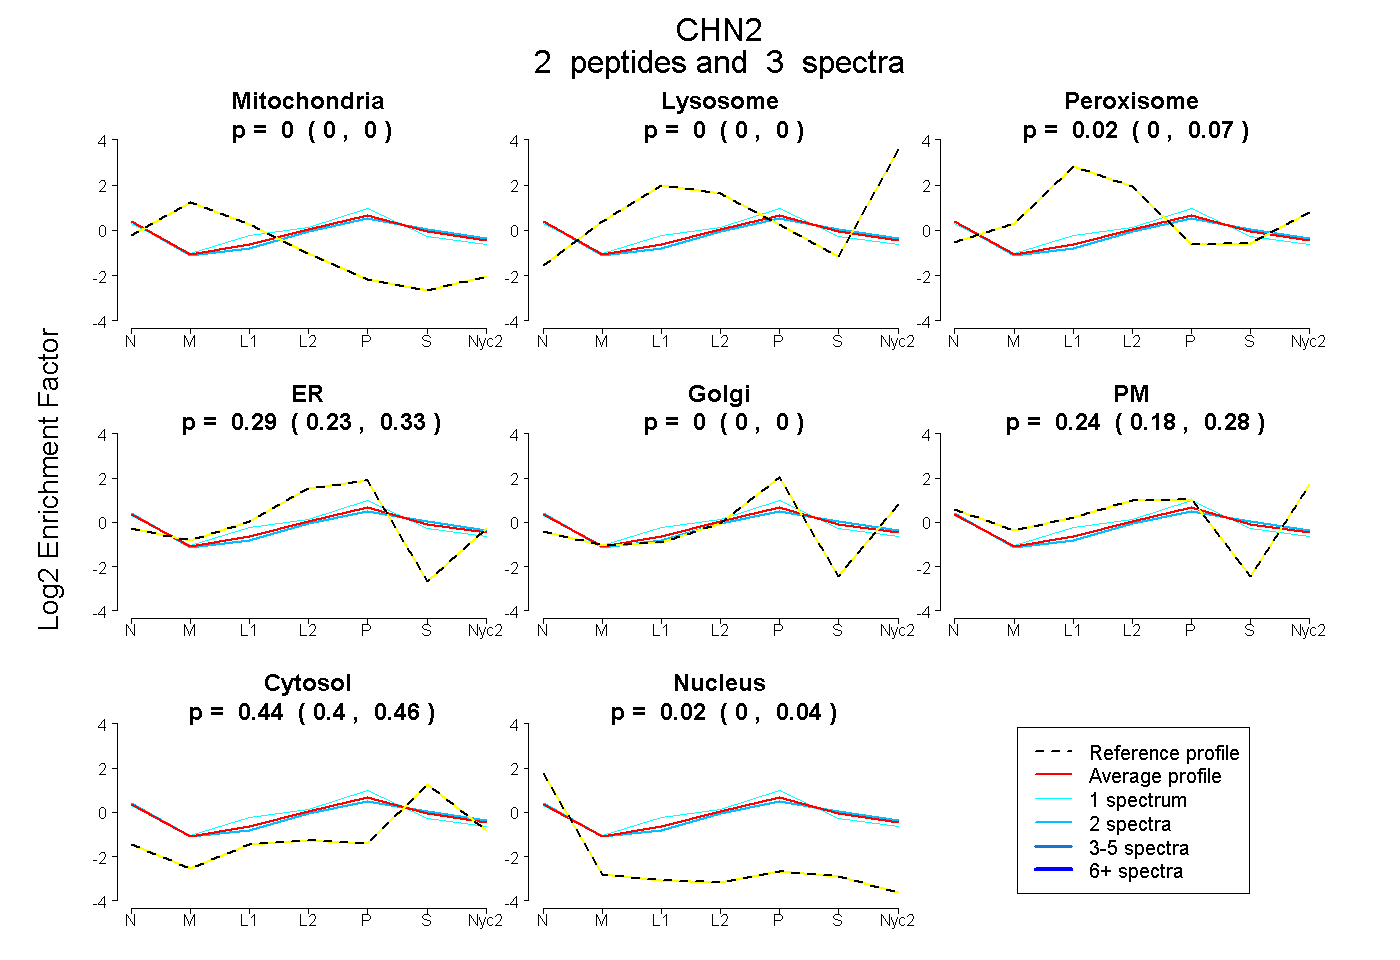
0.000 | 0.000
0.000 | 0.000
0.000 | 0.068
0.229 | 0.332
0.000 | 0.000
0.177 | 0.277
0.402 | 0.459
0.003 | 0.041
| Plot | Mito | Lyso | Perox | ER | Golgi | PM | Cytosol | Nucleus | |||||
| Expt A |
2 peptides |
3 spectra |
|
0.000 0.000 | 0.000 |
0.000 0.000 | 0.000 |
0.018 0.000 | 0.068 |
0.288 0.229 | 0.332 |
0.000 0.000 | 0.000 |
0.236 0.177 | 0.277 |
0.437 0.402 | 0.459 |
0.022 0.003 | 0.041 |
| 1 spectrum, VSGFTEHIEDVK | 0.000 | 0.000 | 0.073 | 0.439 | 0.000 | 0.098 | 0.369 | 0.021 | ||
| 2 spectra, ISNADER | 0.000 | 0.000 | 0.000 | 0.211 | 0.000 | 0.298 | 0.467 | 0.025 |
| Plot | Lyso | Other | |||||||||||
| Expt C |
2 peptides |
10 spectra |
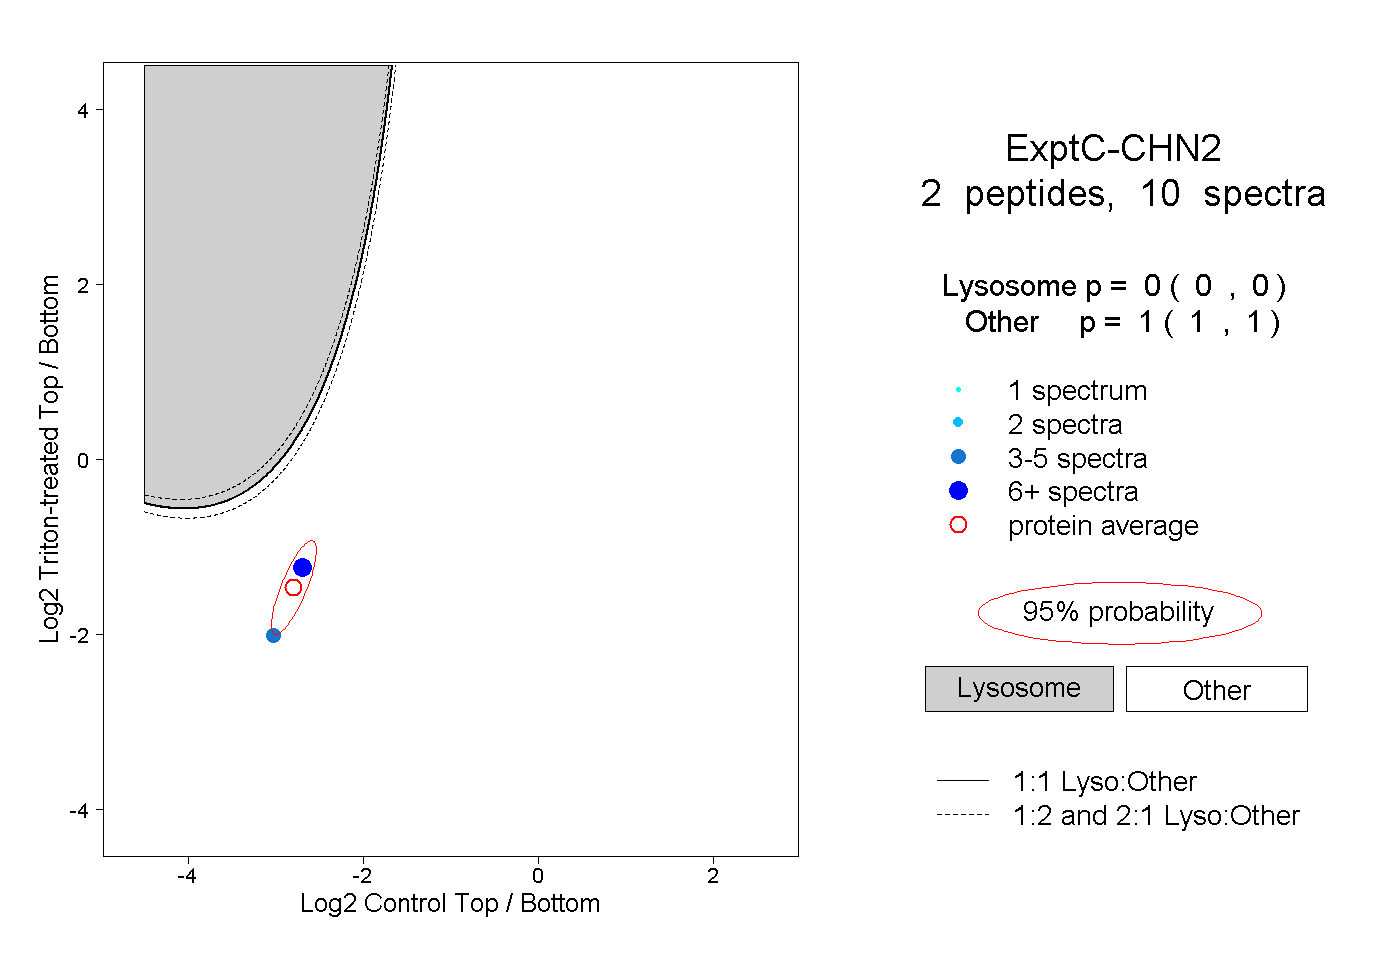 |
0.000 0.000 | 0.000 |
1.000 1.000 | 1.000 |