 1
1peptide
spectrum
NA | NA
NA | NA
NA | NA
NA | NA
NA | NA
NA | NA
NA | NA
| Plot | Mito | Lyso or Perox | ER | Golgi | PM | Cytosol | Nucleus | ||||||
| Expt B |
1 peptide |
1 spectrum |
|
0.000 NA | NA |
0.169 NA | NA |
0.000 NA | NA |
0.438 NA | NA |
0.000 NA | NA |
0.104 NA | NA |
0.289 NA | NA |
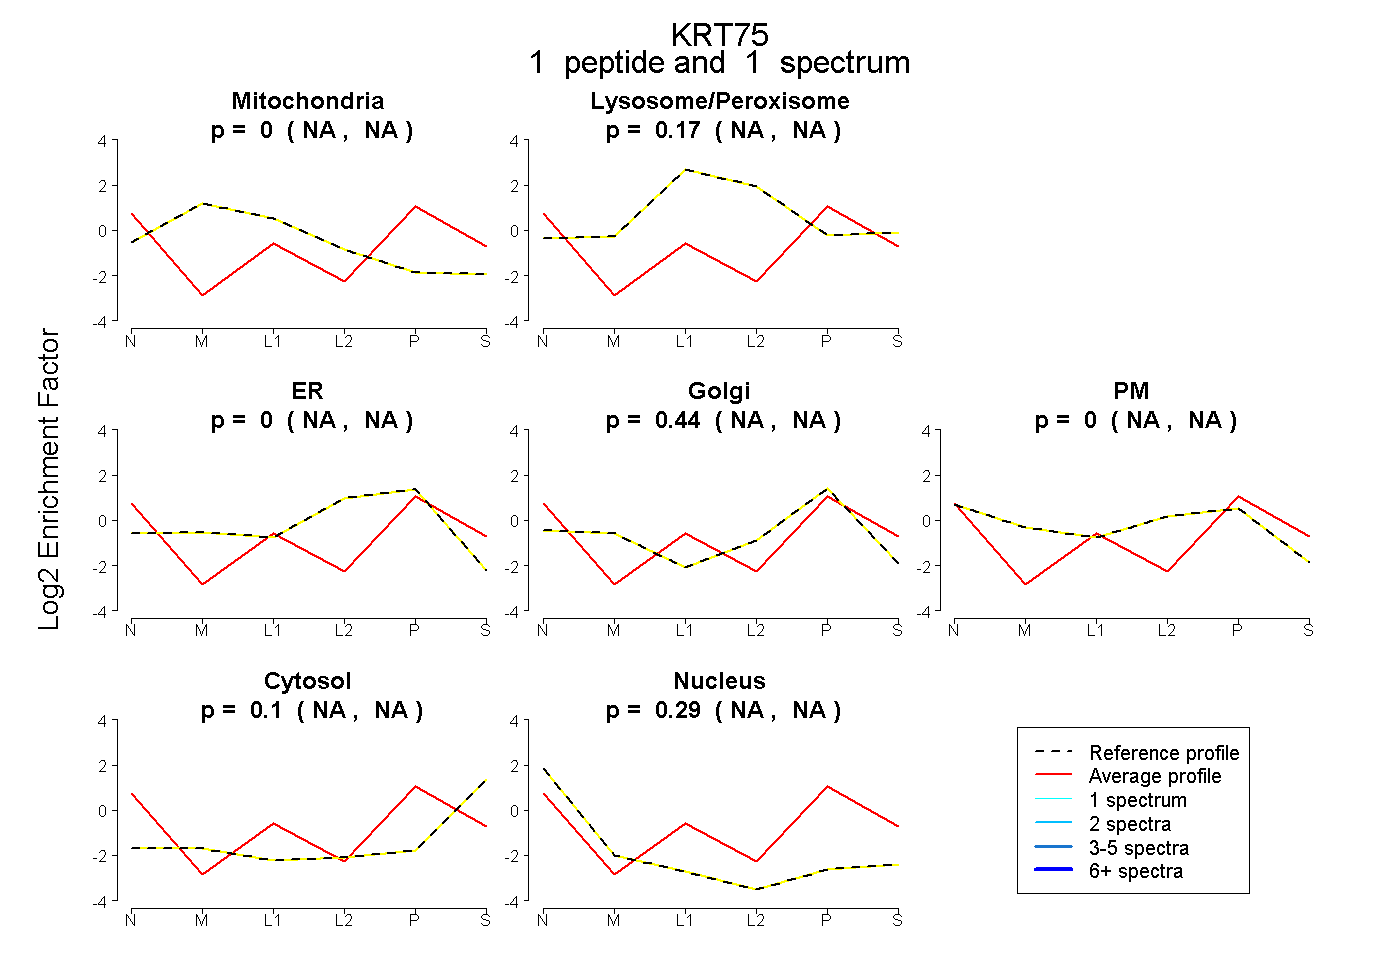
| 1 spectrum, YEELQVTAGR | 0.000 | 0.169 | 0.000 | 0.438 | 0.000 | 0.104 | 0.289 |
| Plot | Lyso | Other | |||||||||||
| Expt C |
1 peptide |
1 spectrum |
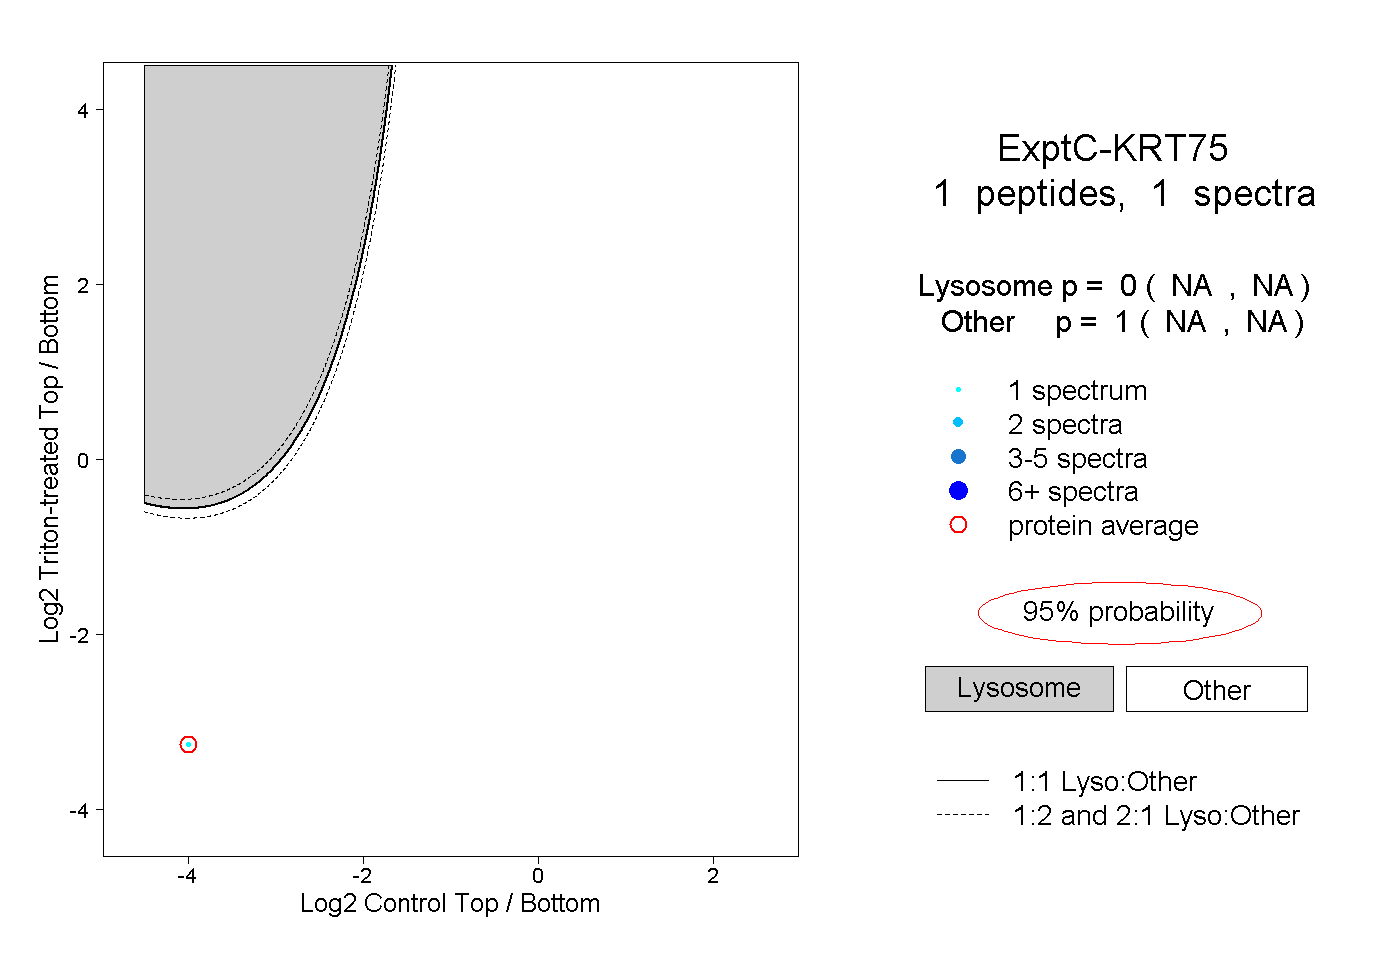 |
0.000 NA | NA |
1.000 NA | NA |