 2
2peptides
spectra
0.000 | 0.000
0.000 | 0.157
0.000 | 0.088
0.000 | 0.059
0.000 | 0.120
0.166 | 0.438
0.479 | 0.575
0.000 | 0.000
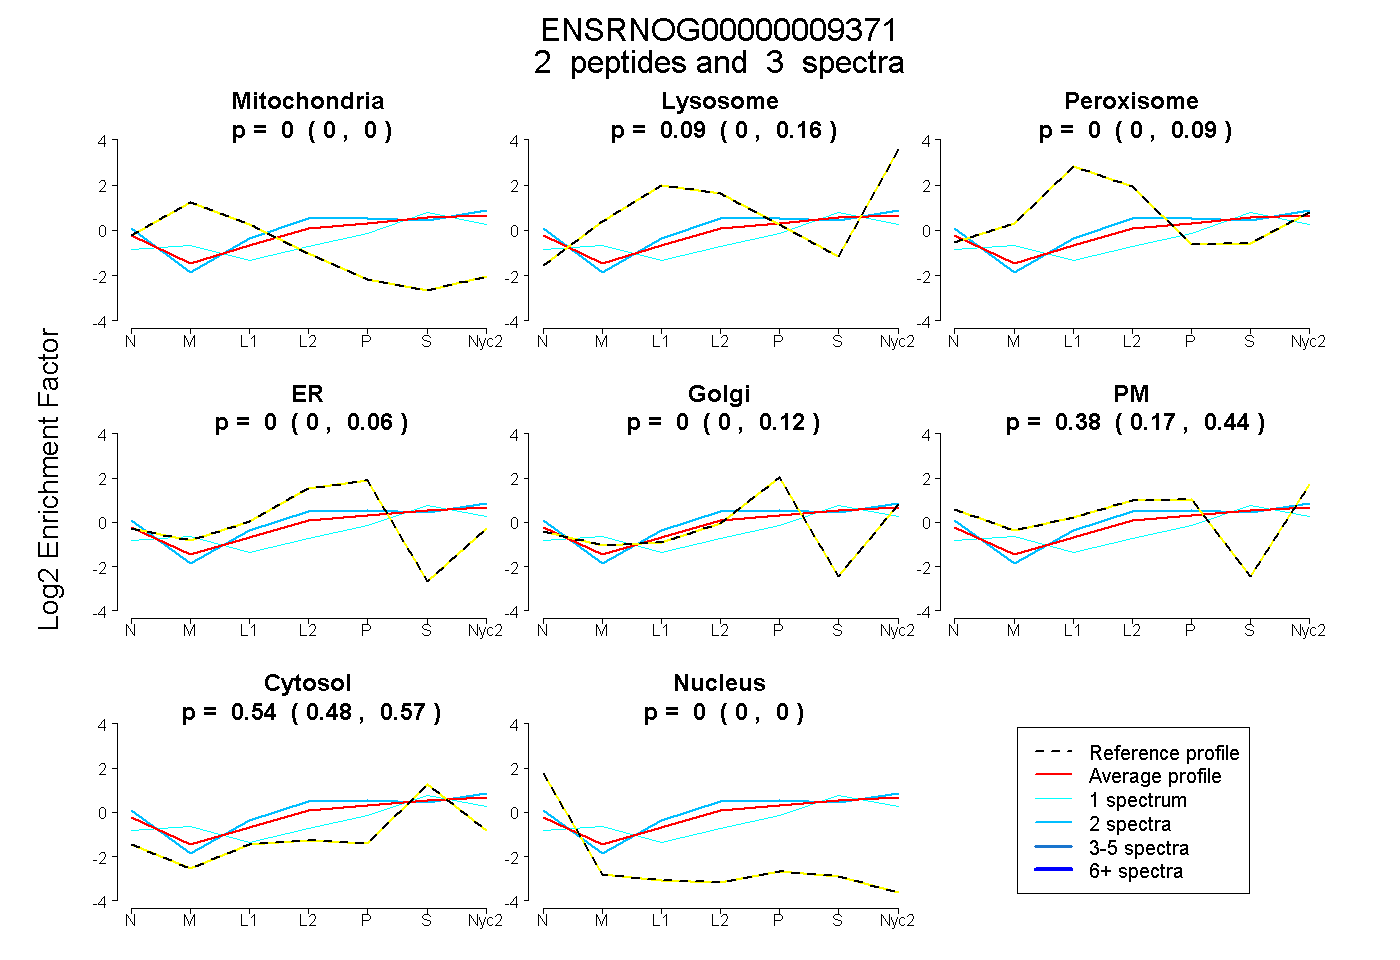
| Plot | Mito | Lyso | Perox | ER | Golgi | PM | Cytosol | Nucleus | |||||
| Expt A |
2 peptides |
3 spectra |
|
0.000 0.000 | 0.000 |
0.086 0.000 | 0.157 |
0.000 0.000 | 0.088 |
0.000 0.000 | 0.059 |
0.000 0.000 | 0.120 |
0.375 0.166 | 0.438 |
0.539 0.479 | 0.575 |
0.000 0.000 | 0.000 |
| 2 spectra, HPNLVQLLGVCTR | 0.000 | 0.061 | 0.031 | 0.000 | 0.000 | 0.438 | 0.470 | 0.000 | ||
| 1 spectrum, MLEICLK | 0.024 | 0.138 | 0.000 | 0.000 | 0.177 | 0.038 | 0.624 | 0.000 |