3
3peptides
spectra
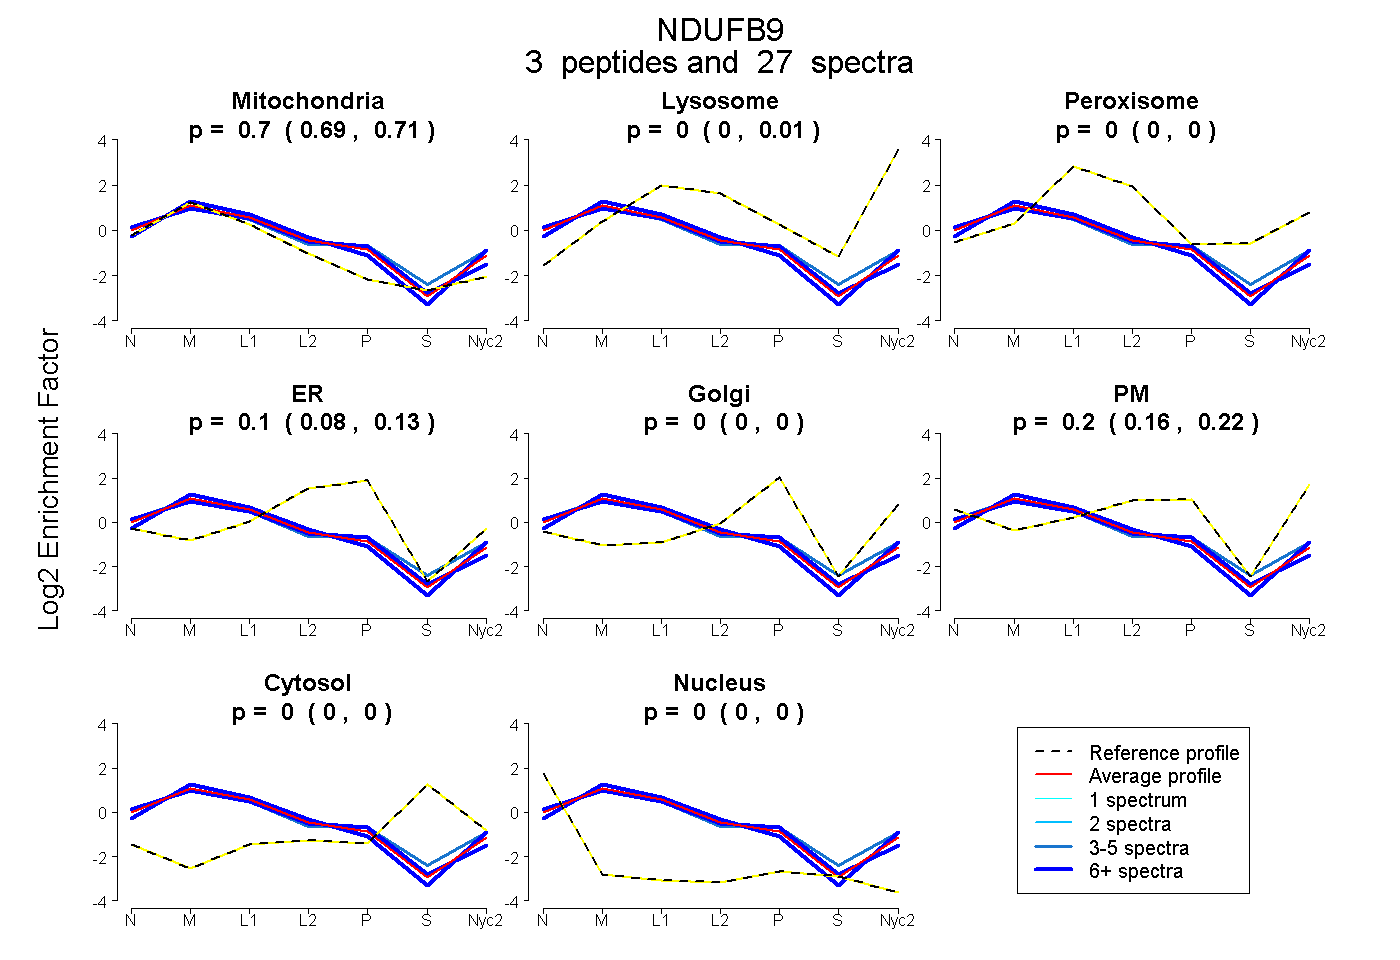
0.688 | 0.706
0.000 | 0.013
0.000 | 0.004
0.076 | 0.126
0.000 | 0.000
0.162 | 0.221
0.000 | 0.000
0.000 | 0.000
5peptides
spectra
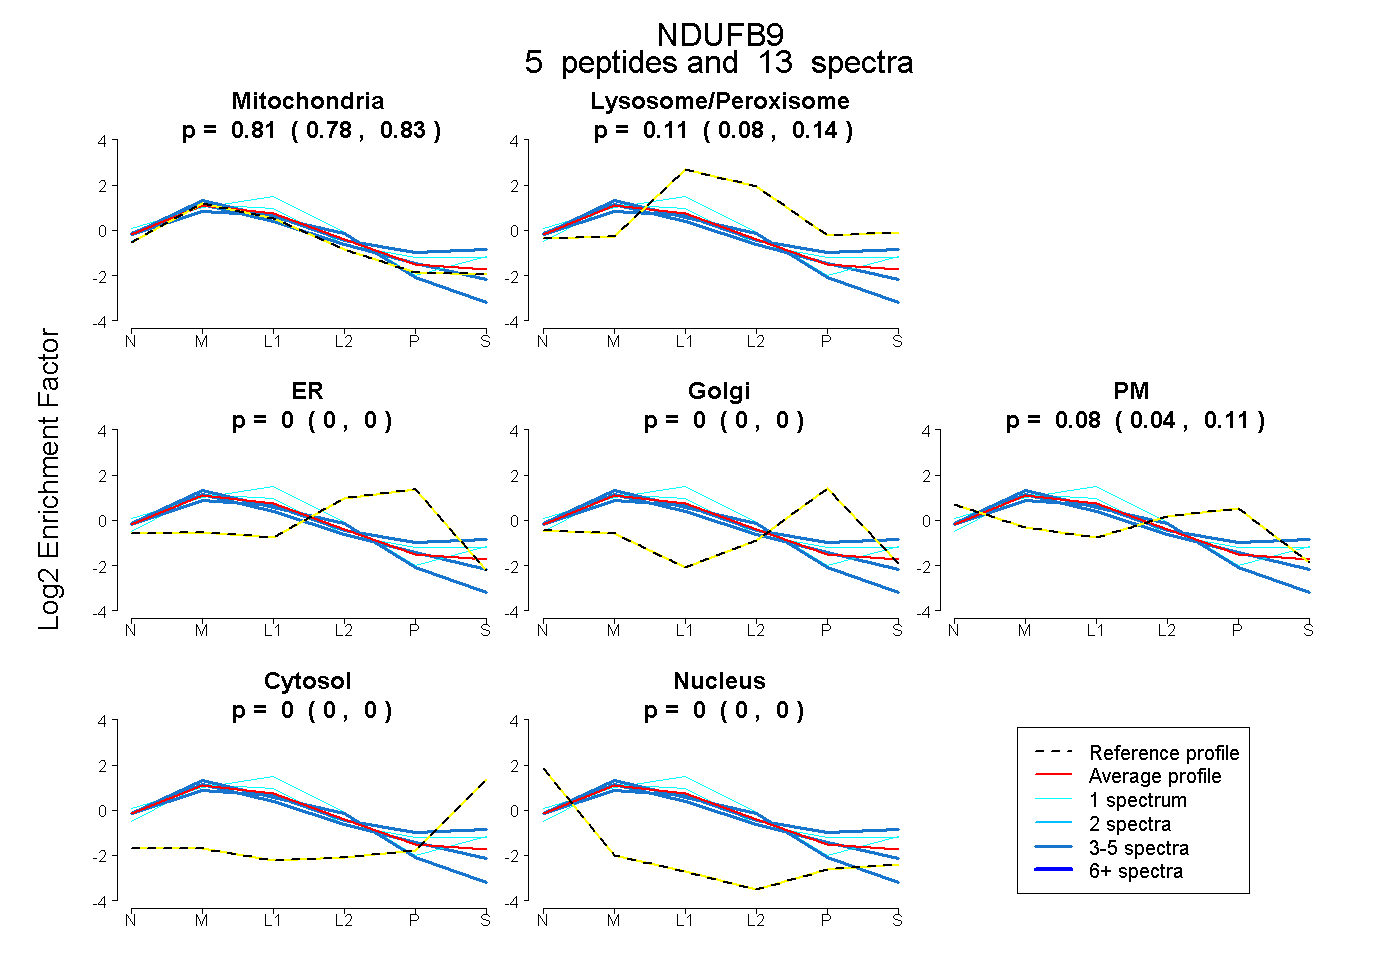
0.777 | 0.835
0.081 | 0.143
0.000 | 0.000
0.000 | 0.000
0.039 | 0.106
0.000 | 0.000
0.000 | 0.005