 5
5peptides
spectra
0.000 | 0.000
0.000 | 0.020
0.000 | 0.000
0.000 | 0.000
0.000 | 0.000
0.000 | 0.000
0.972 | 1.000
0.000 | 0.000
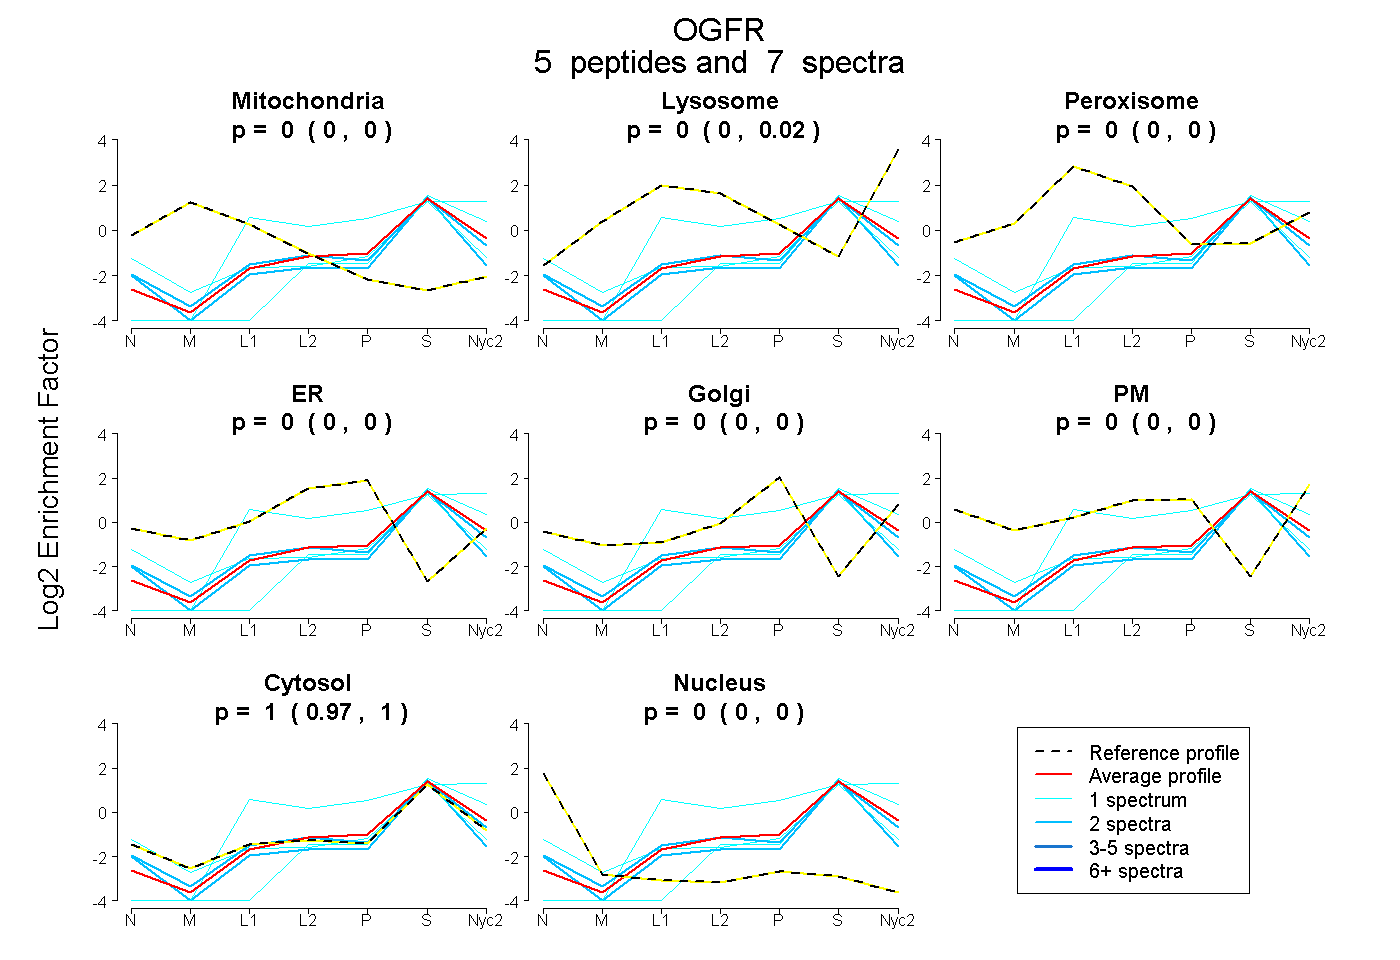
| Plot | Mito | Lyso | Perox | ER | Golgi | PM | Cytosol | Nucleus | |||||
| Expt A |
5 peptides |
7 spectra |
|
0.000 0.000 | 0.000 |
0.000 0.000 | 0.020 |
0.000 0.000 | 0.000 |
0.000 0.000 | 0.000 |
0.000 0.000 | 0.000 |
0.000 0.000 | 0.000 |
1.000 0.972 | 1.000 |
0.000 0.000 | 0.000 |
| 1 spectrum, IEASAEPPKP | 0.000 | 0.346 | 0.000 | 0.000 | 0.000 | 0.000 | 0.654 | 0.000 | ||
| 1 spectrum, QSALDYFLFAVR | 0.000 | 0.000 | 0.000 | 0.000 | 0.000 | 0.000 | 0.947 | 0.053 | ||
| 1 spectrum, DGNGPEDSNSQVGAEDSK | 0.000 | 0.000 | 0.000 | 0.000 | 0.000 | 0.000 | 1.000 | 0.000 | ||
| 2 spectra, SLGELGLEHYQAPLVR | 0.000 | 0.000 | 0.000 | 0.000 | 0.000 | 0.000 | 1.000 | 0.000 | ||
| 2 spectra, EAEPPCPVAR | 0.000 | 0.000 | 0.000 | 0.000 | 0.000 | 0.000 | 0.961 | 0.039 |
| Plot | Lyso | Other | |||||||||||
| Expt C |
4 peptides |
9 spectra |
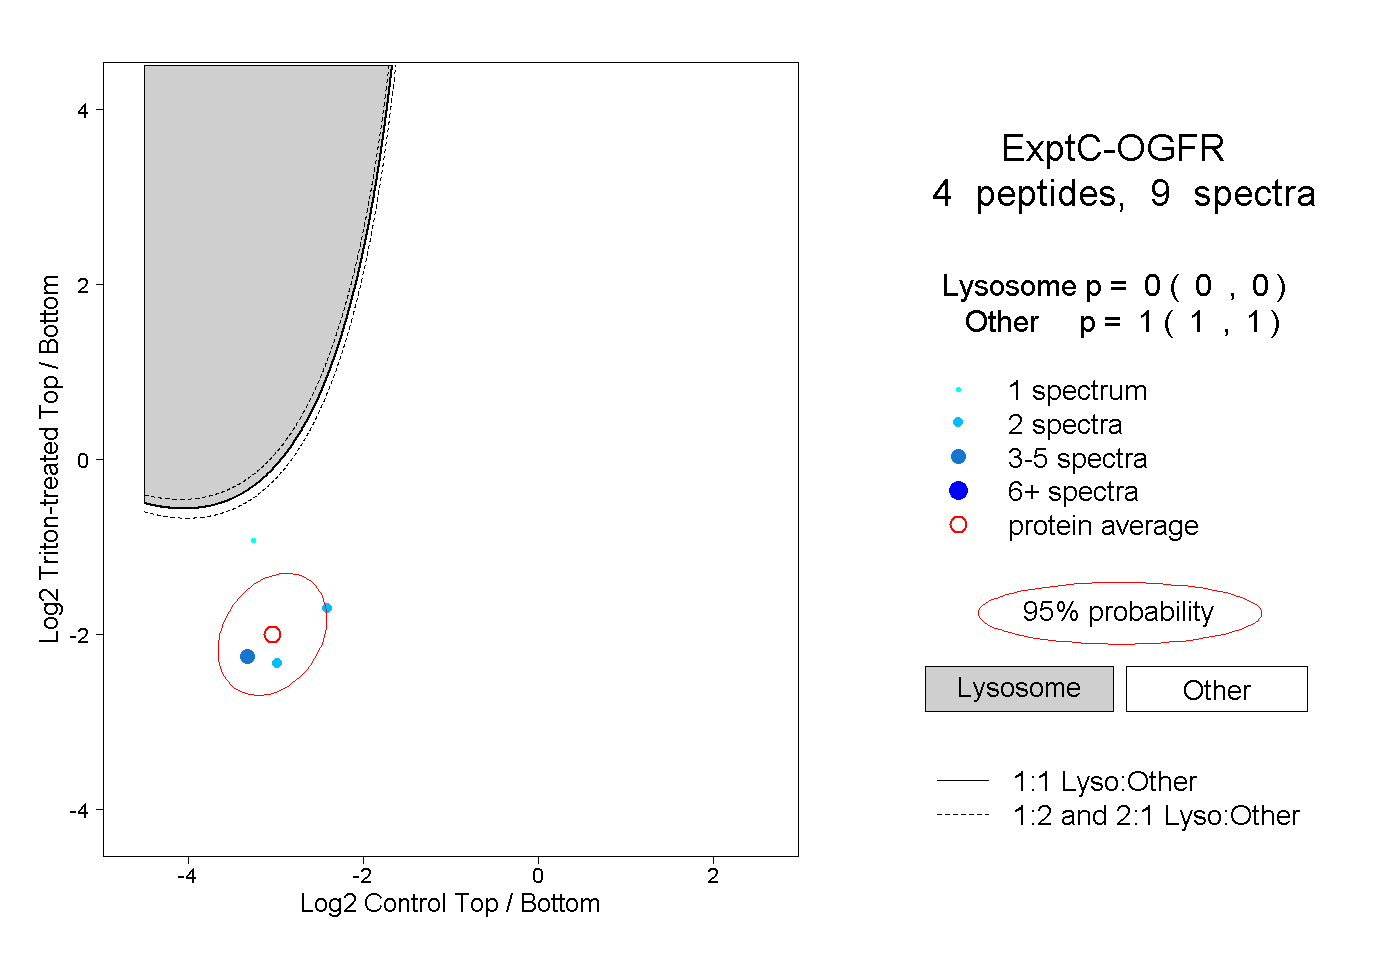 |
0.000 0.000 | 0.000 |
1.000 1.000 | 1.000 |