 1
1peptide
spectra
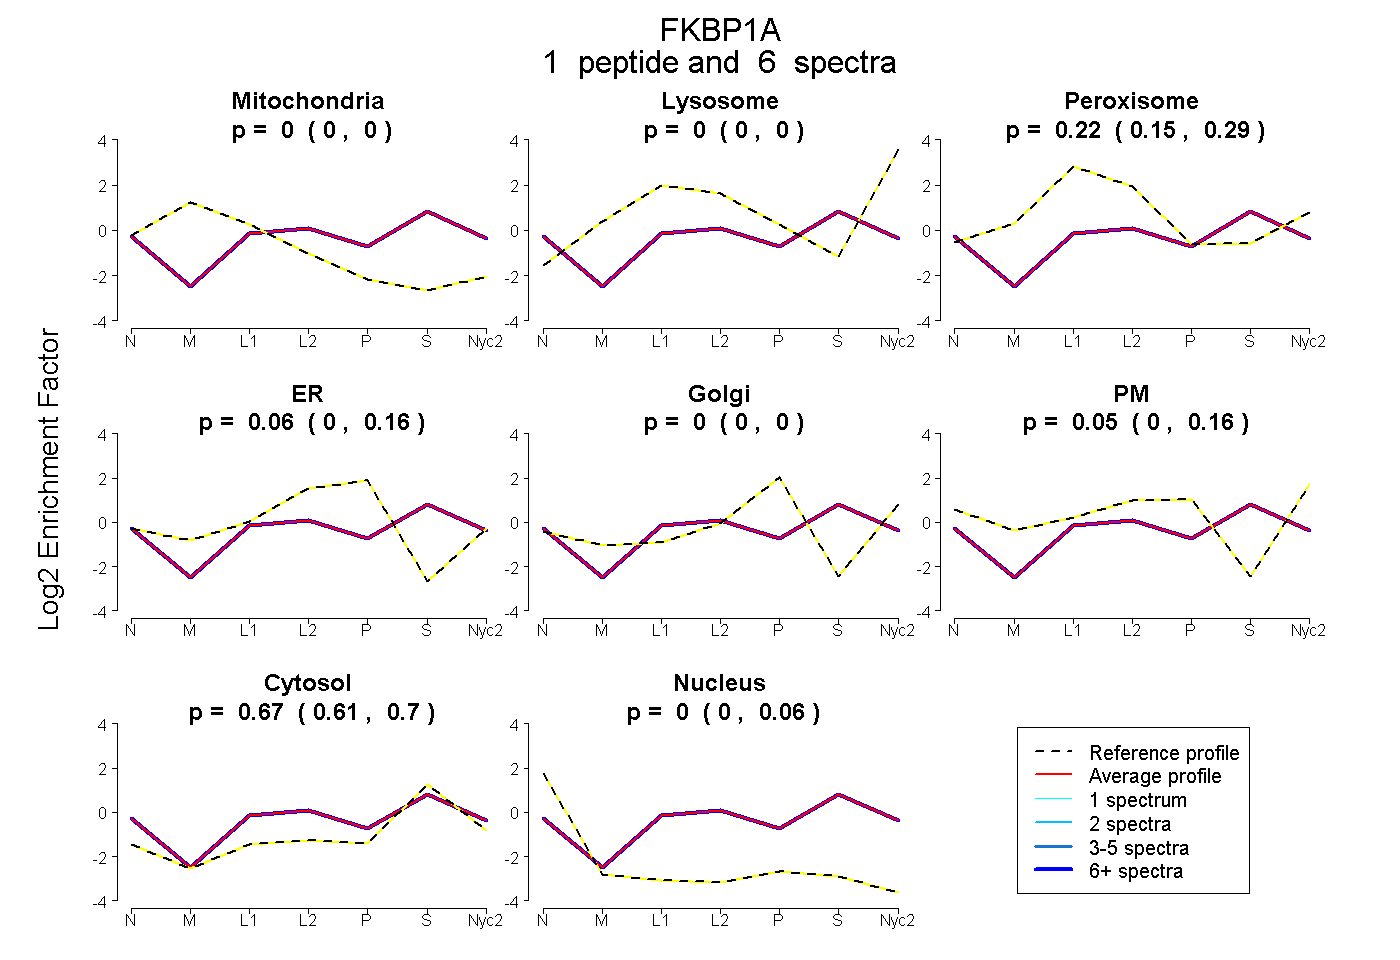
0.000 | 0.000
0.000 | 0.000
0.149 | 0.292
0.000 | 0.157
0.000 | 0.000
0.000 | 0.156
0.608 | 0.698
0.000 | 0.056
1peptide
spectra
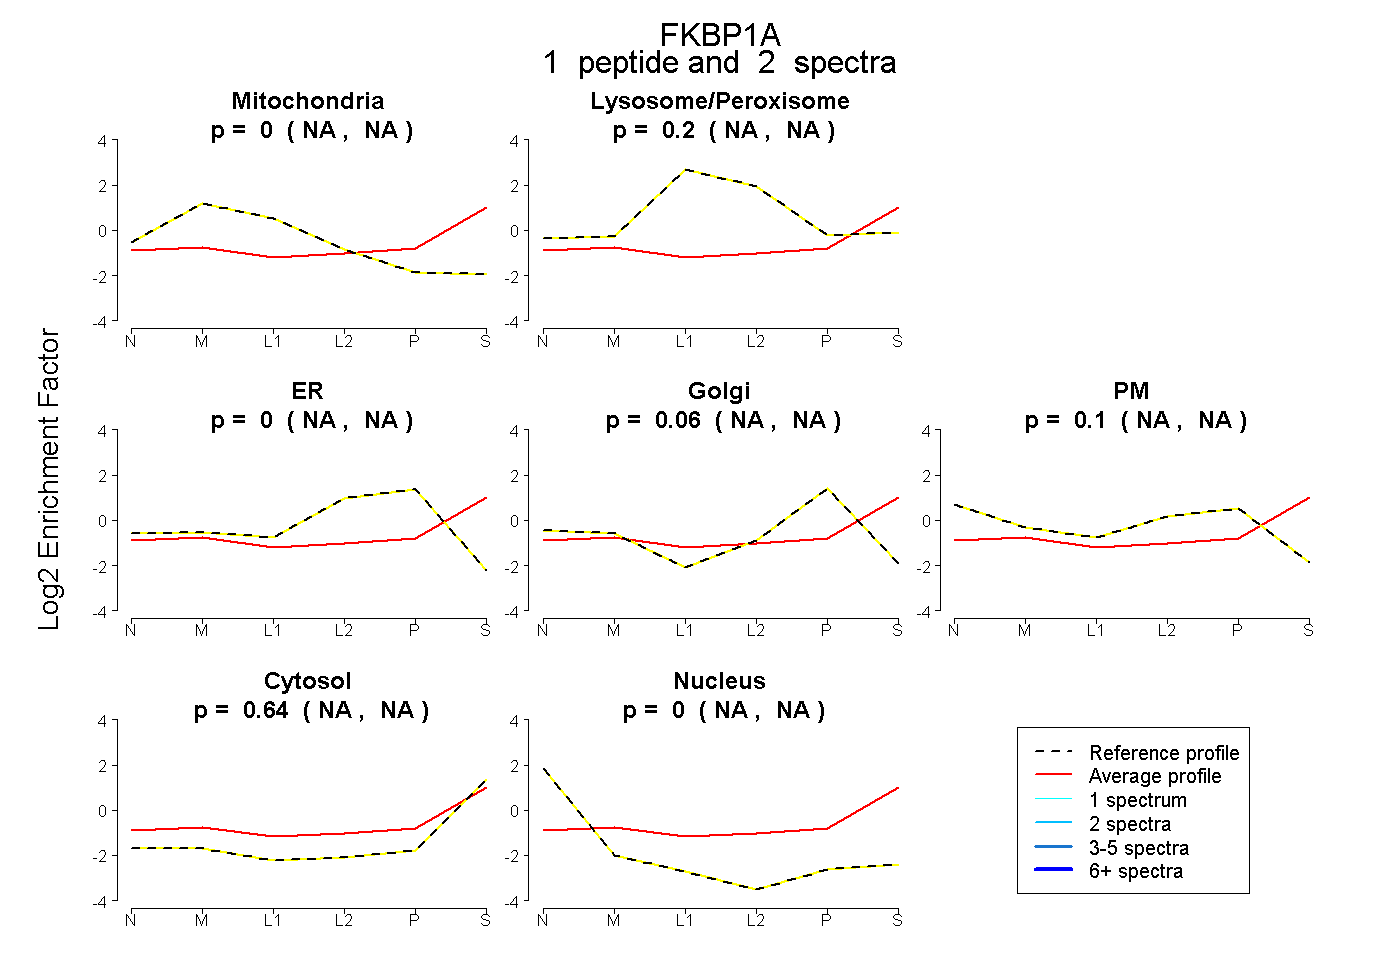
NA | NA
NA | NA
NA | NA
NA | NA
NA | NA
NA | NA
NA | NA
2peptides
spectra
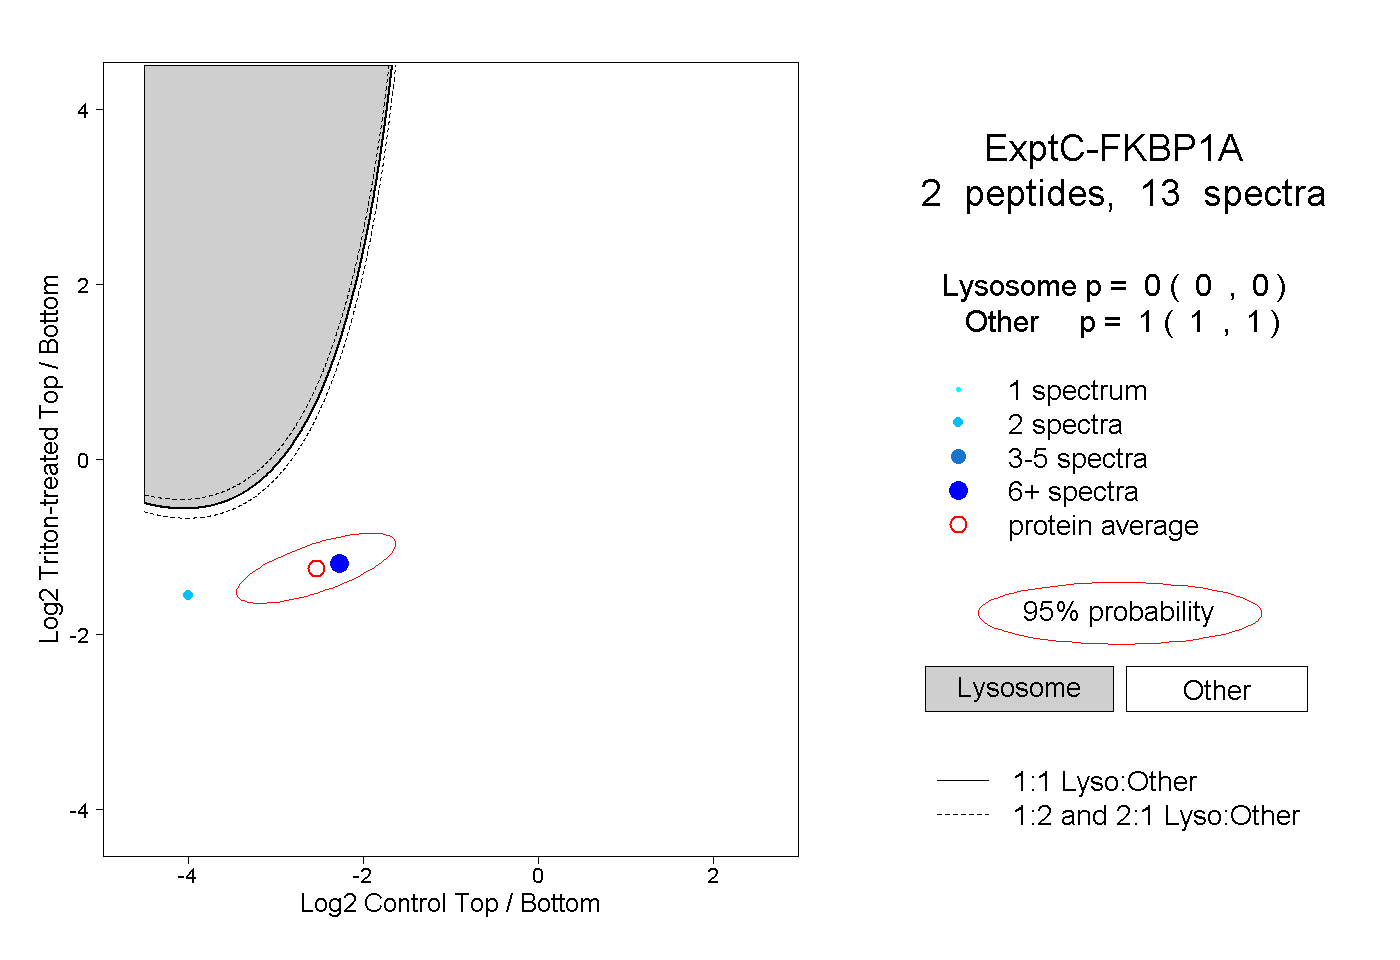
0.000 | 0.000
1.000 | 1.000
1peptide
spectra
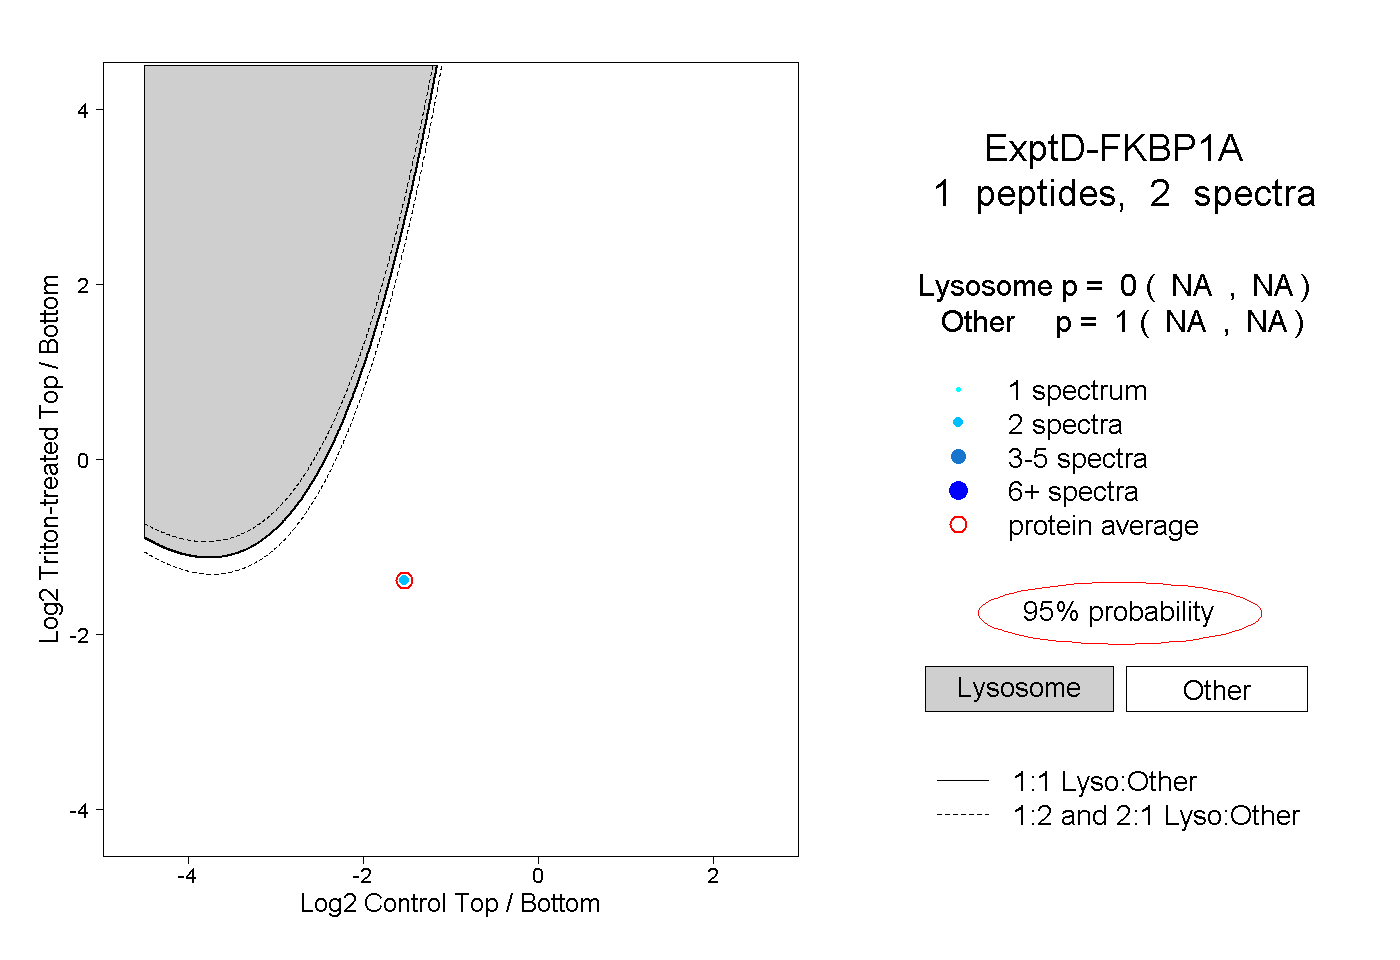
NA | NA
NA | NA