 3
3peptides
spectra
0.000 | 0.000
0.000 | 0.000
0.000 | 0.000
0.526 | 0.743
0.000 | 0.292
0.000 | 0.063
0.039 | 0.250
0.000 | 0.054
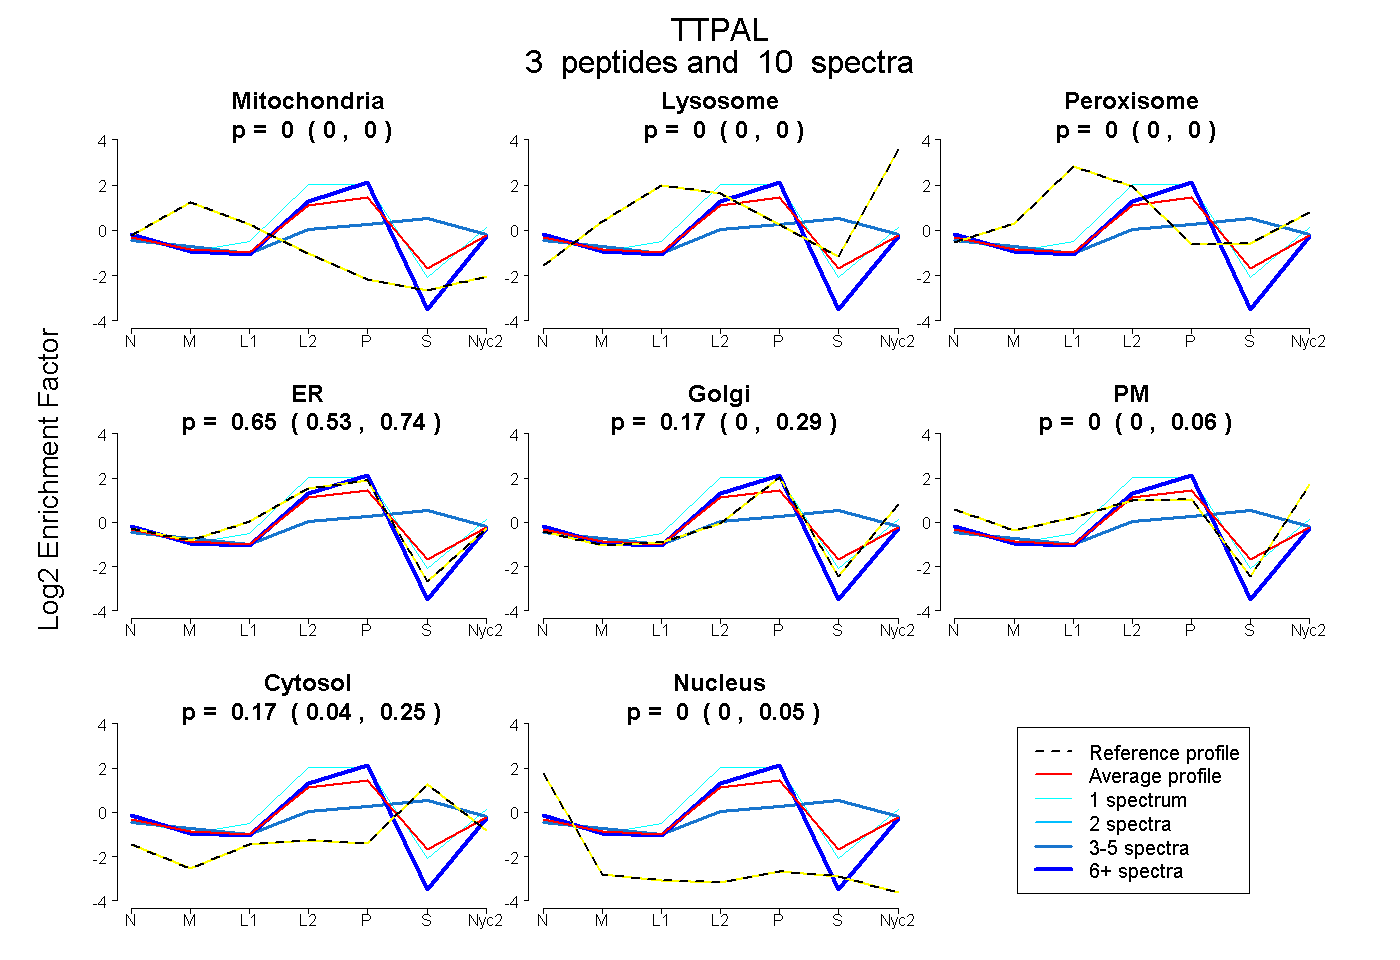
| Plot | Mito | Lyso | Perox | ER | Golgi | PM | Cytosol | Nucleus | |||||
| Expt A |
3 peptides |
10 spectra |
|
0.000 0.000 | 0.000 |
0.000 0.000 | 0.000 |
0.000 0.000 | 0.000 |
0.654 0.526 | 0.743 |
0.174 0.000 | 0.292 |
0.000 0.000 | 0.063 |
0.173 0.039 | 0.250 |
0.000 0.000 | 0.054 |
| 3 spectra, ASHFGPFIAR | 0.000 | 0.000 | 0.111 | 0.114 | 0.115 | 0.129 | 0.532 | 0.000 | ||
| 1 spectrum, ALQLLVNYHGCR | 0.000 | 0.033 | 0.000 | 0.910 | 0.029 | 0.000 | 0.027 | 0.000 | ||
| 6 spectra, VIGILQDGFPIR | 0.000 | 0.000 | 0.000 | 0.744 | 0.212 | 0.000 | 0.000 | 0.044 |