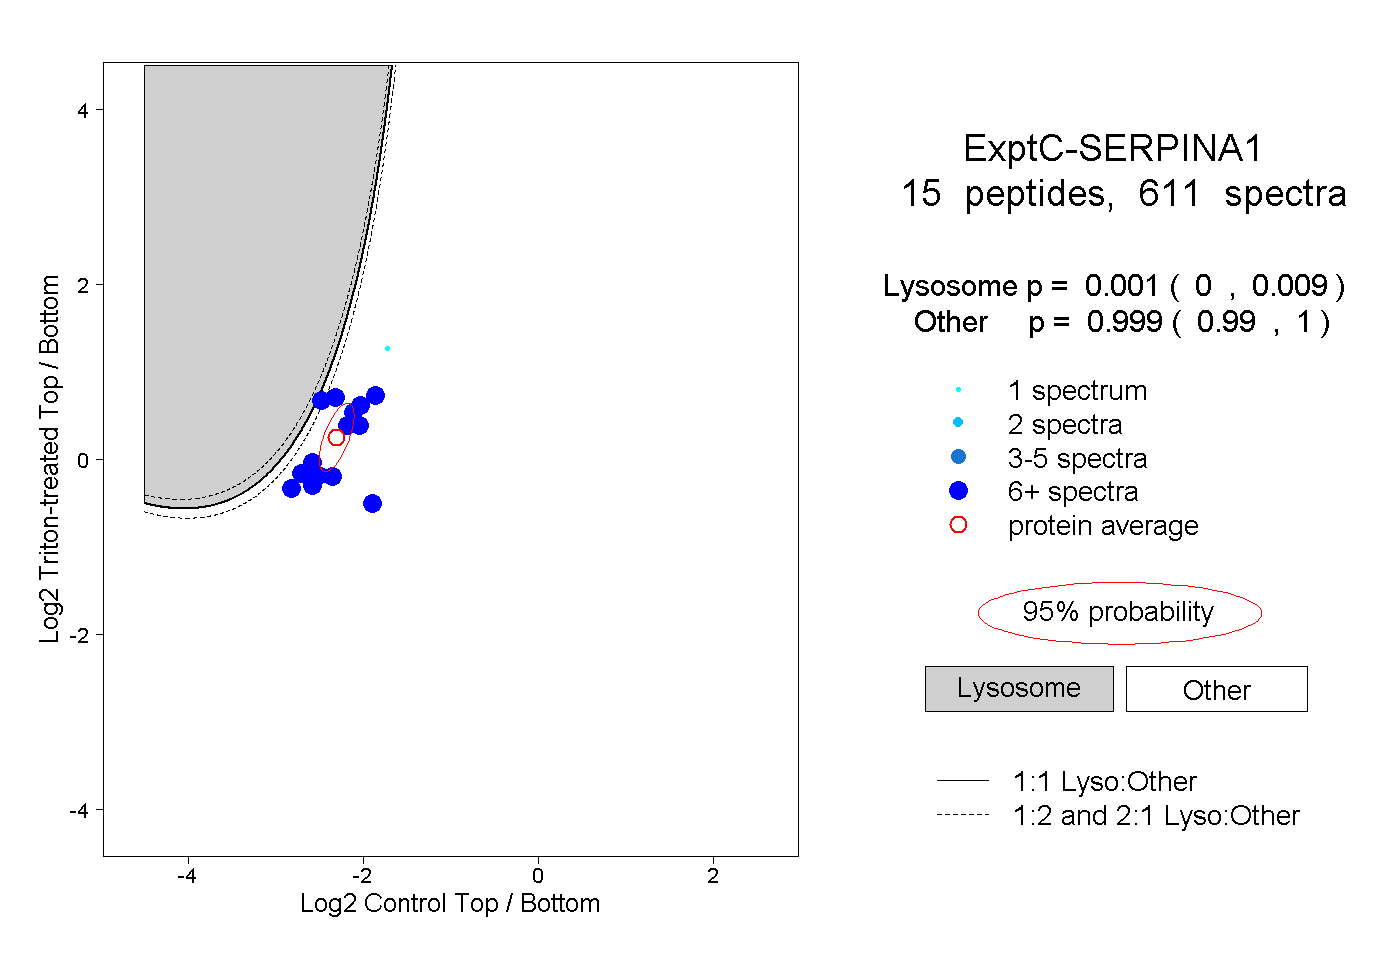
16
16peptides
spectra
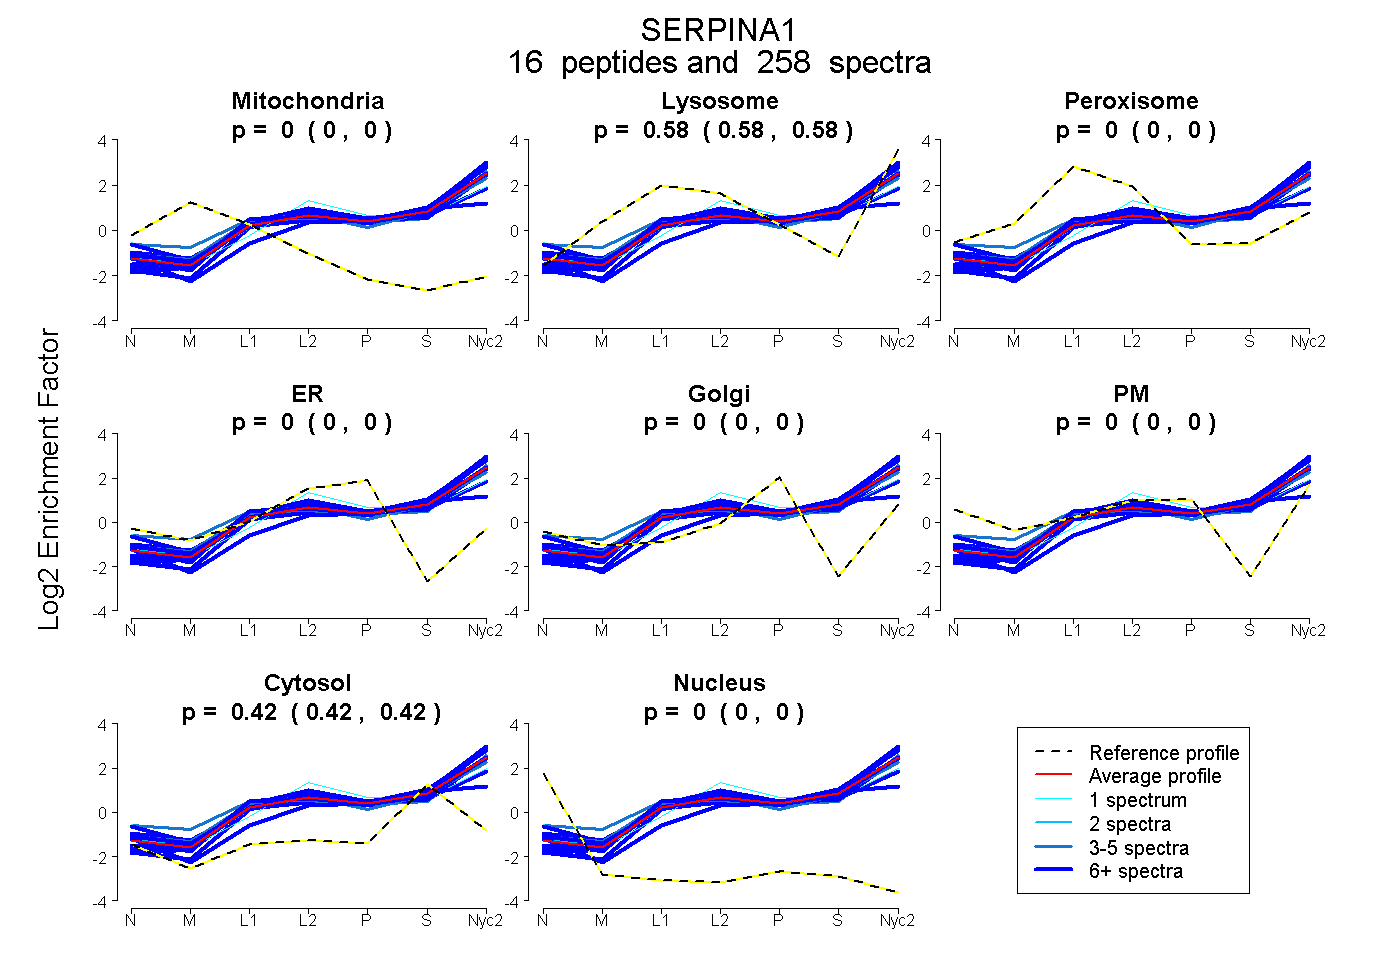
0.000 | 0.000
0.579 | 0.581
0.000 | 0.000
0.000 | 0.000
0.000 | 0.000
0.000 | 0.000
0.419 | 0.421
0.000 | 0.000
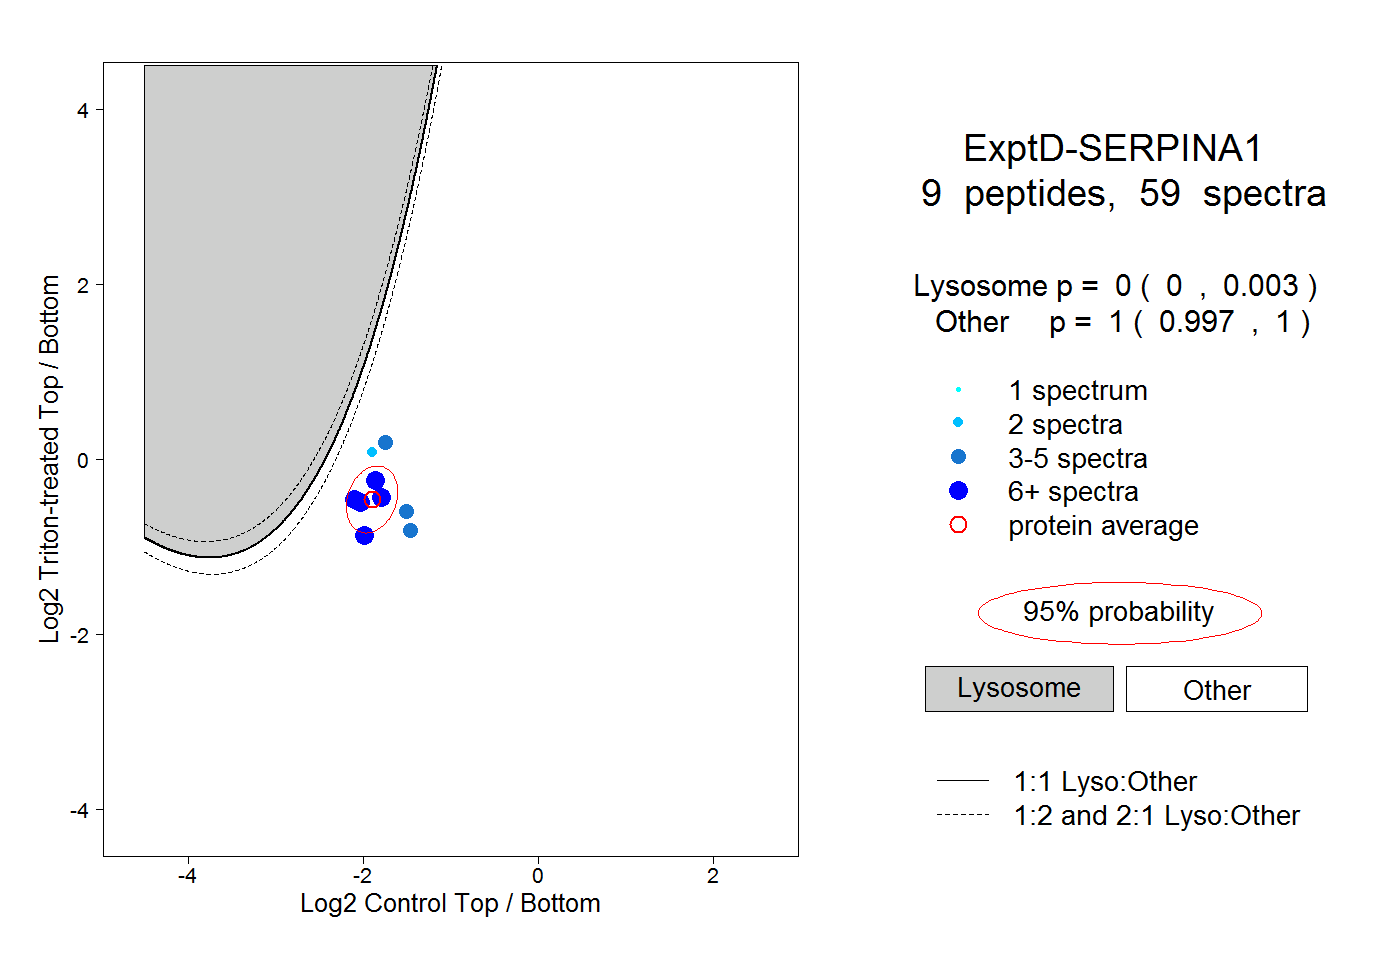
15peptides
spectra
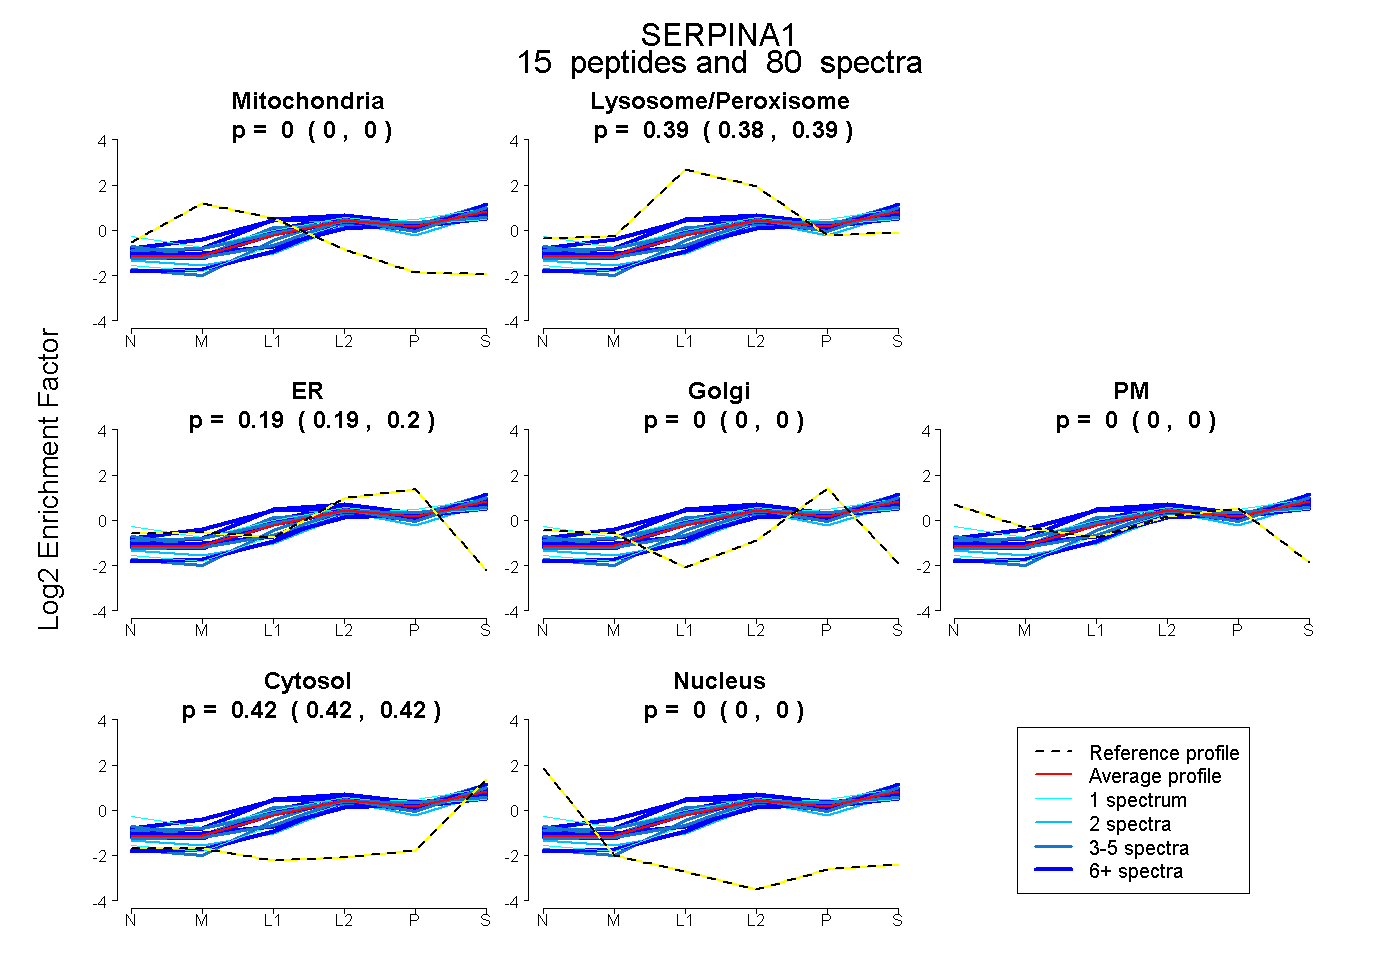
0.000 | 0.000
0.383 | 0.393
0.188 | 0.196
0.000 | 0.000
0.000 | 0.000
0.417 | 0.421
0.000 | 0.000