 16
16peptides
spectra
0.000 | 0.000
0.579 | 0.581
0.000 | 0.000
0.000 | 0.000
0.000 | 0.000
0.000 | 0.000
0.419 | 0.421
0.000 | 0.000
| Plot | Mito | Lyso | Perox | ER | Golgi | PM | Cytosol | Nucleus | |||||
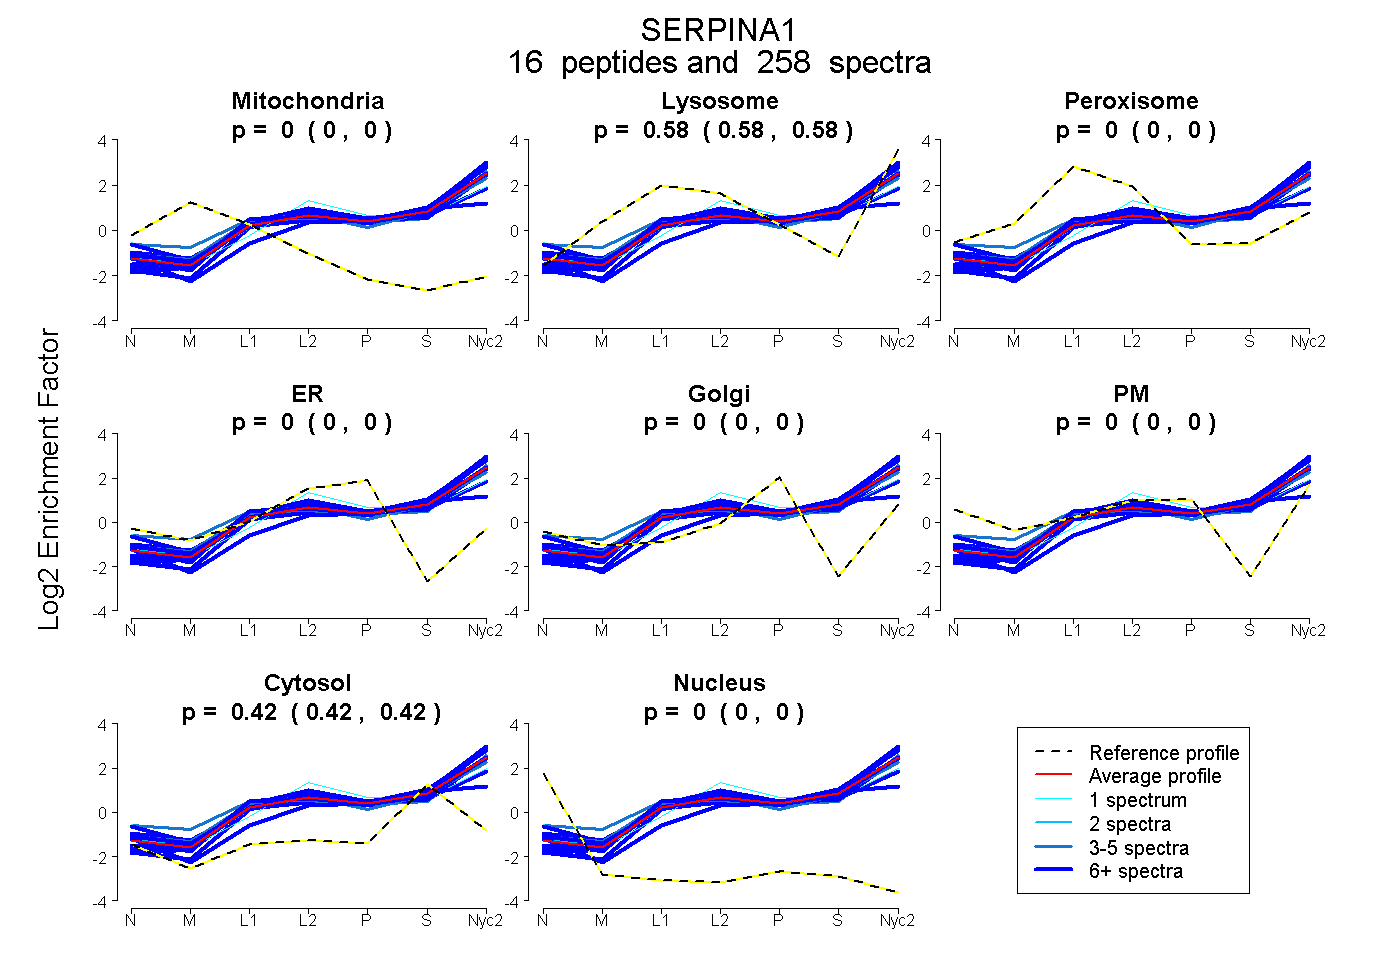
| Expt A |
16 peptides |
258 spectra |
|
0.000 0.000 | 0.000 |
0.580 0.579 | 0.581 |
0.000 0.000 | 0.000 |
0.000 0.000 | 0.000 |
0.000 0.000 | 0.000 |
0.000 0.000 | 0.000 |
0.420 0.419 | 0.421 |
0.000 0.000 | 0.000 |
| 18 spectra, DADFHVDK | 0.000 | 0.609 | 0.000 | 0.000 | 0.000 | 0.000 | 0.391 | 0.000 | ||
| 4 spectra, MQHLEQTLTK | 0.000 | 0.584 | 0.000 | 0.000 | 0.000 | 0.087 | 0.329 | 0.000 | ||
| 16 spectra, VINDYVEK | 0.000 | 0.592 | 0.000 | 0.000 | 0.000 | 0.000 | 0.408 | 0.000 | ||
| 10 spectra, SAILYFPK | 0.000 | 0.620 | 0.000 | 0.000 | 0.000 | 0.000 | 0.380 | 0.000 | ||
| 22 spectra, LSQAVHK | 0.000 | 0.494 | 0.000 | 0.000 | 0.080 | 0.000 | 0.426 | 0.000 | ||
| 23 spectra, VIDPTR | 0.000 | 0.297 | 0.000 | 0.000 | 0.130 | 0.000 | 0.573 | 0.000 | ||
| 8 spectra, FLEEVK | 0.000 | 0.565 | 0.000 | 0.000 | 0.000 | 0.000 | 0.435 | 0.000 | ||
| 50 spectra, VPMMNR | 0.000 | 0.620 | 0.000 | 0.000 | 0.000 | 0.000 | 0.380 | 0.000 | ||
| 1 spectrum, NNYHSEAFSVNFADSEEAK | 0.000 | 0.390 | 0.000 | 0.002 | 0.000 | 0.228 | 0.380 | 0.000 | ||
| 26 spectra, AVLTLDER | 0.000 | 0.565 | 0.000 | 0.000 | 0.000 | 0.000 | 0.435 | 0.000 | ||
| 2 spectra, ISSNLADFAFSLYR | 0.000 | 0.617 | 0.000 | 0.000 | 0.000 | 0.000 | 0.383 | 0.000 | ||
| 3 spectra, VFNNDADLSGITEDAPLK | 0.000 | 0.582 | 0.000 | 0.000 | 0.000 | 0.000 | 0.418 | 0.000 | ||
| 18 spectra, RPFNPEHTR | 0.000 | 0.515 | 0.000 | 0.000 | 0.000 | 0.119 | 0.367 | 0.000 | ||
| 14 spectra, IVDLMK | 0.000 | 0.614 | 0.000 | 0.000 | 0.000 | 0.000 | 0.386 | 0.000 | ||
| 5 spectra, LSISGTYNLK | 0.000 | 0.565 | 0.000 | 0.000 | 0.000 | 0.000 | 0.435 | 0.000 | ||
| 38 spectra, TLLSSLGITR | 0.000 | 0.644 | 0.000 | 0.000 | 0.000 | 0.000 | 0.356 | 0.000 |
| Plot | Mito | Lyso or Perox | ER | Golgi | PM | Cytosol | Nucleus | ||||||
| Expt B |
15 peptides |
80 spectra |
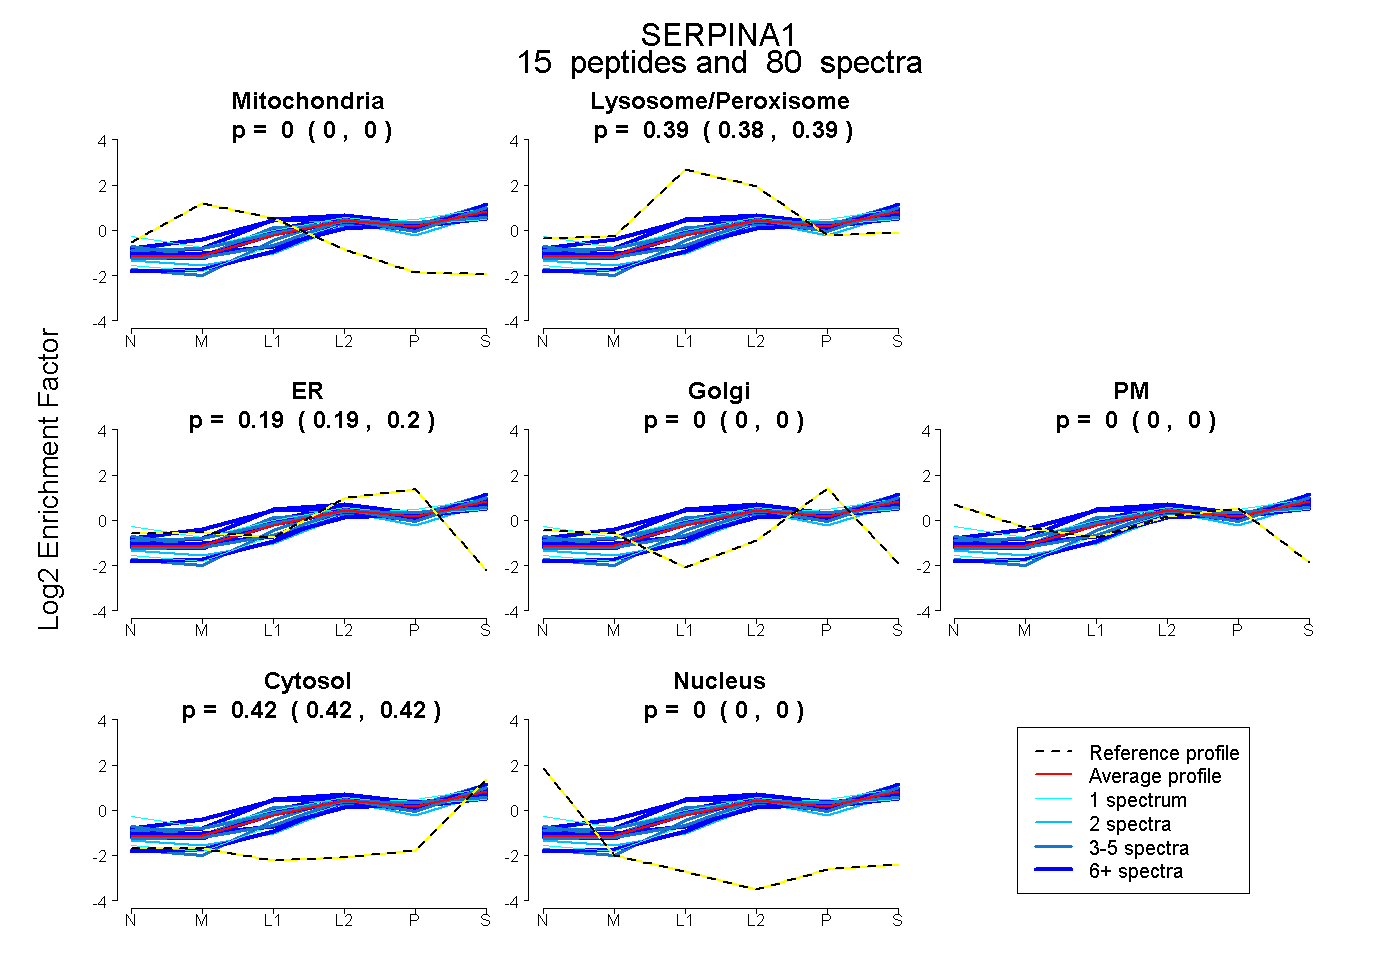 |
0.000 0.000 | 0.000 |
0.388 0.383 | 0.393 |
0.193 0.188 | 0.196 |
0.000 0.000 | 0.000 |
0.000 0.000 | 0.000 |
0.419 0.417 | 0.421 |
0.000 0.000 | 0.000 |
|||
| Plot | Lyso | Other | |||||||||||
| Expt C |
15 peptides |
611 spectra |
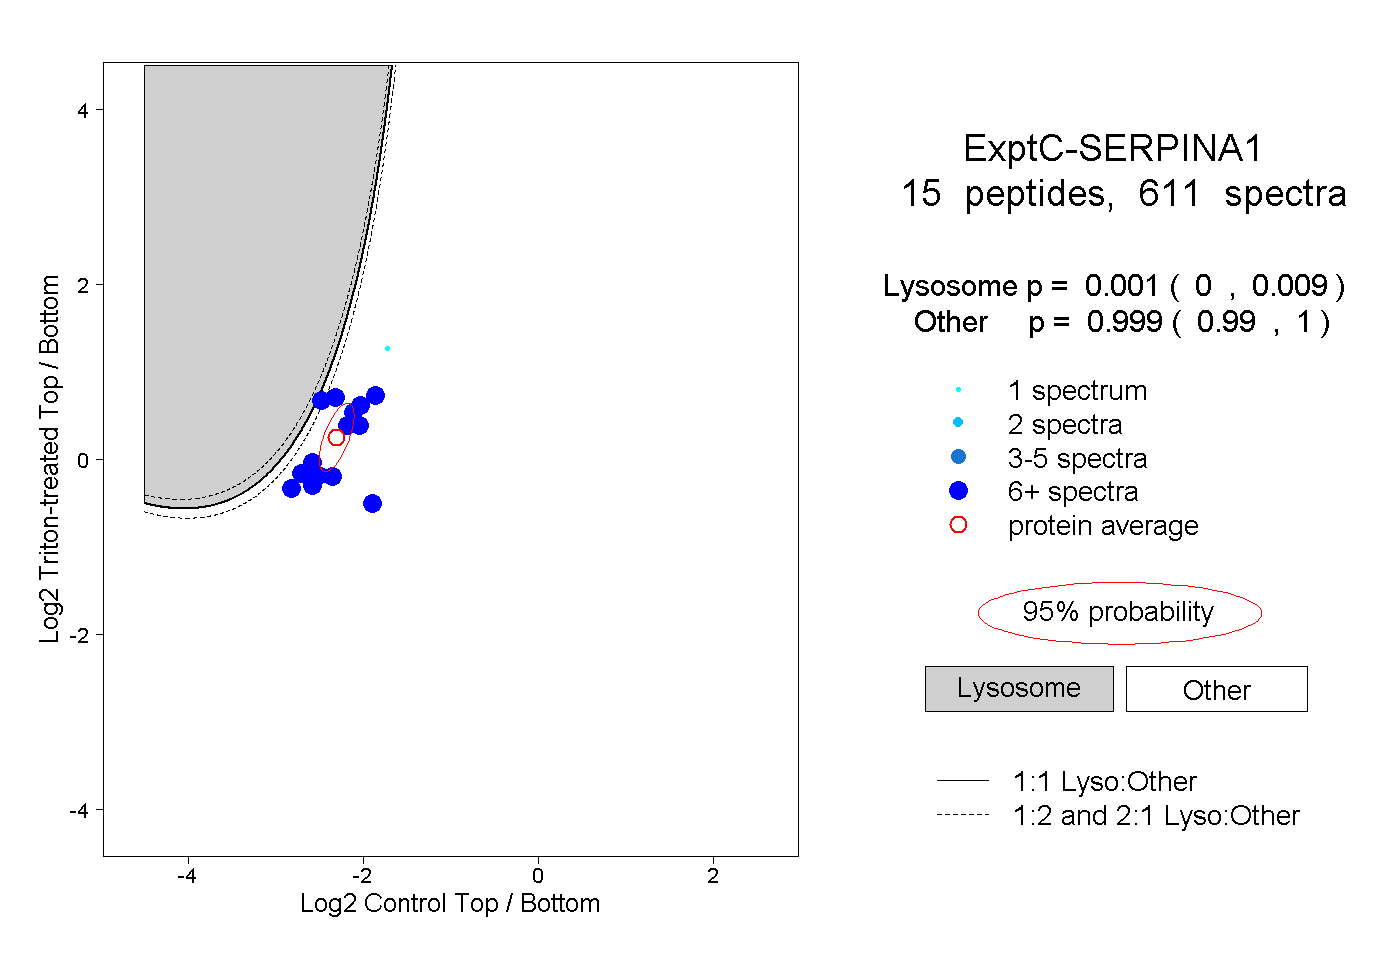 |
0.001 0.000 | 0.009 |
0.999 0.990 | 1.000 |
||||||||
| Plot | Lyso | Other | |||||||||||
| Expt D |
9 peptides |
59 spectra |
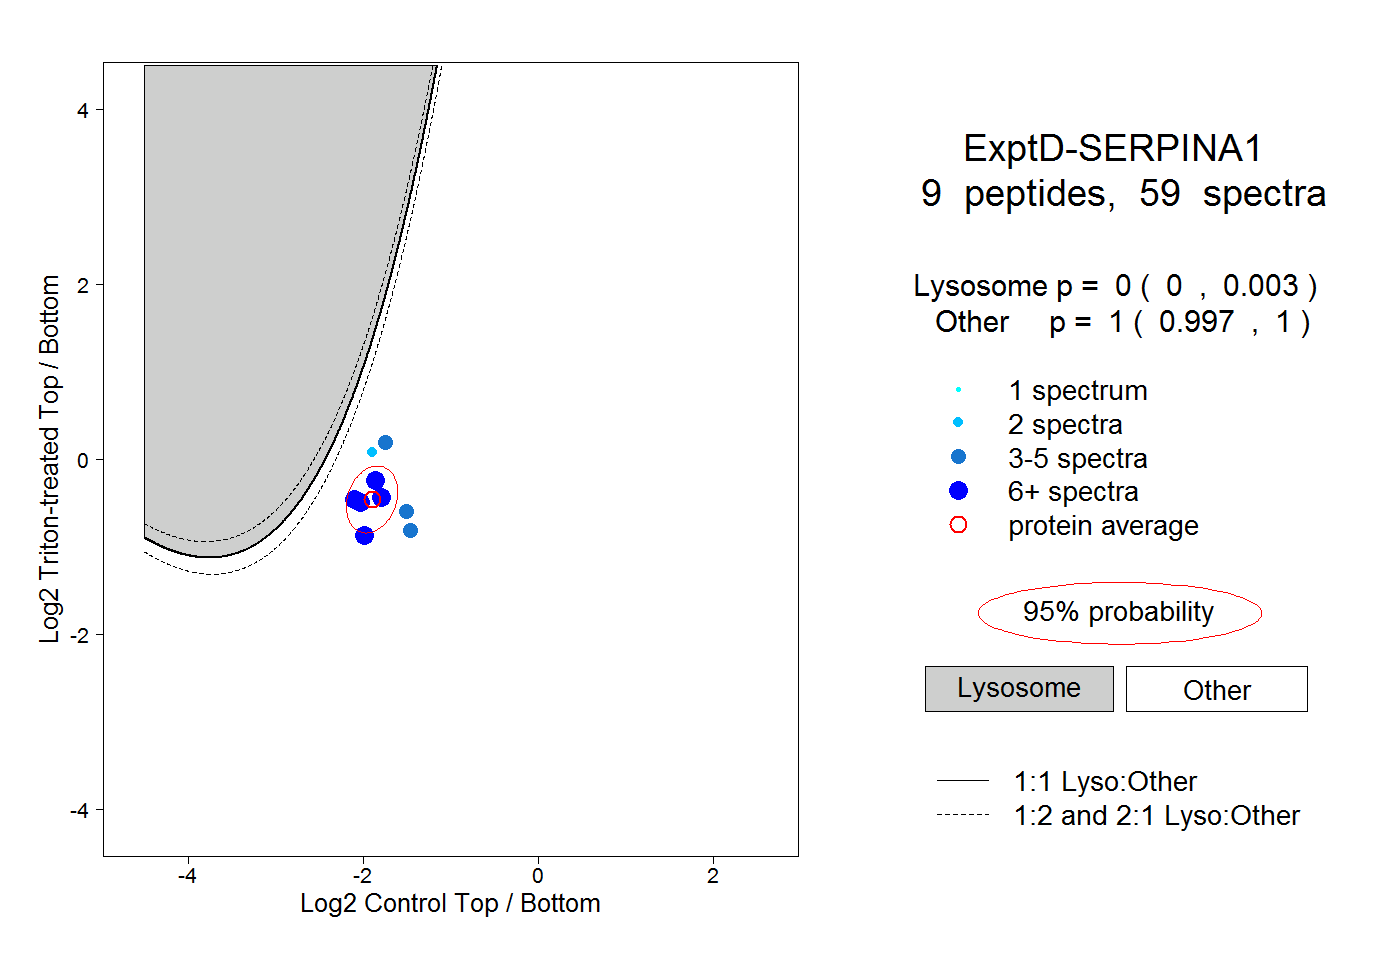 |
0.000 0.000 | 0.003 |
1.000 0.997 | 1.000 |