6
6peptides
spectra

0.000 | 0.000
0.924 | 0.968
0.027 | 0.072
0.000 | 0.000
0.000 | 0.000
0.000 | 0.000
0.000 | 0.000
0.000 | 0.000
6peptides
spectra
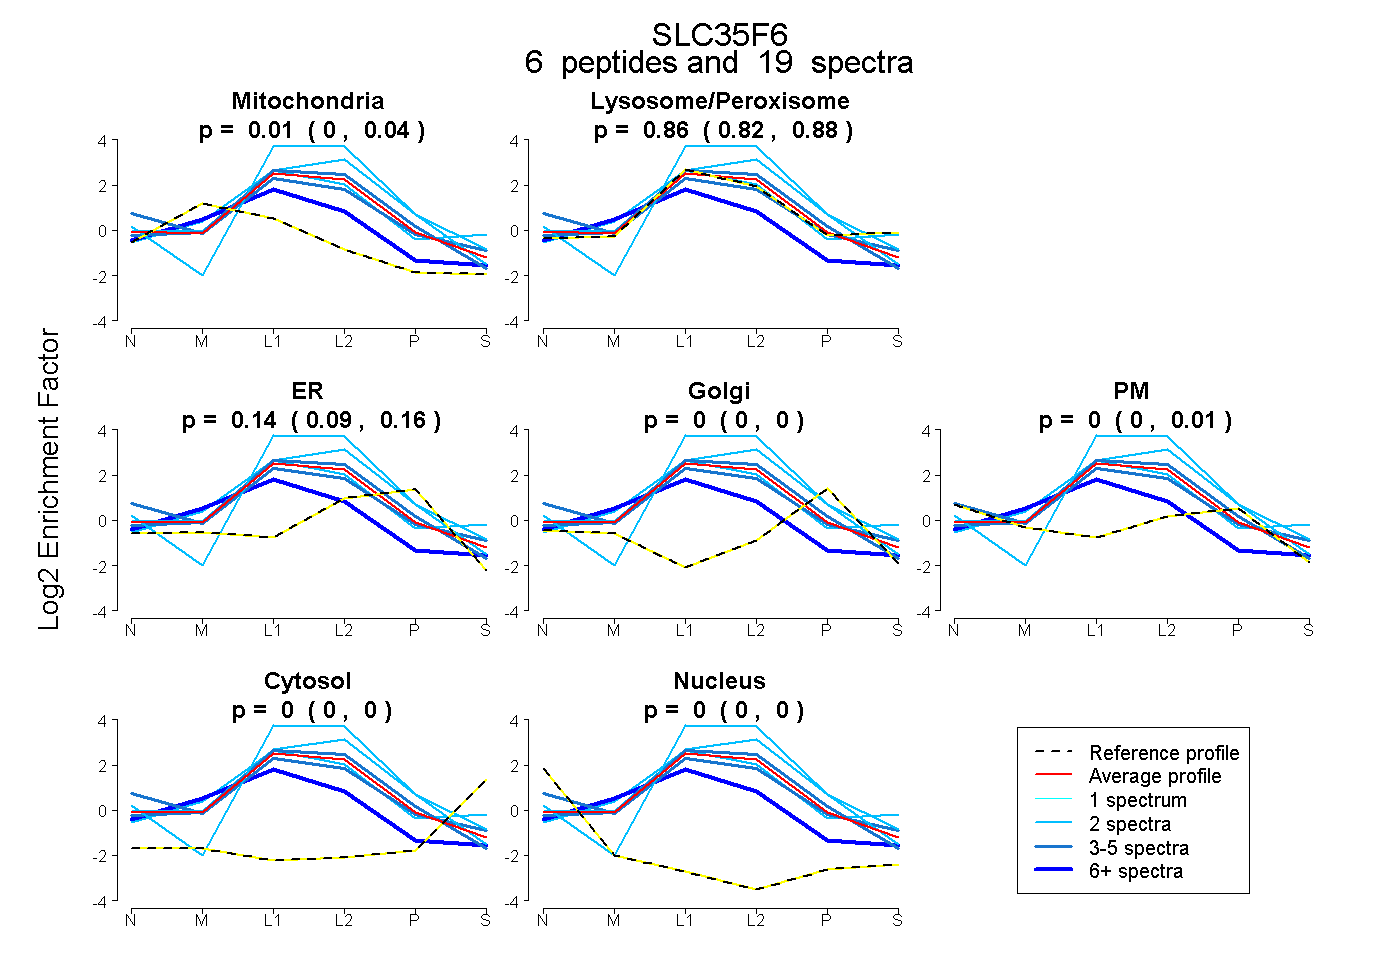
0.000 | 0.041
0.823 | 0.883
0.092 | 0.158
0.000 | 0.000
0.000 | 0.010
0.000 | 0.000
0.000 | 0.000
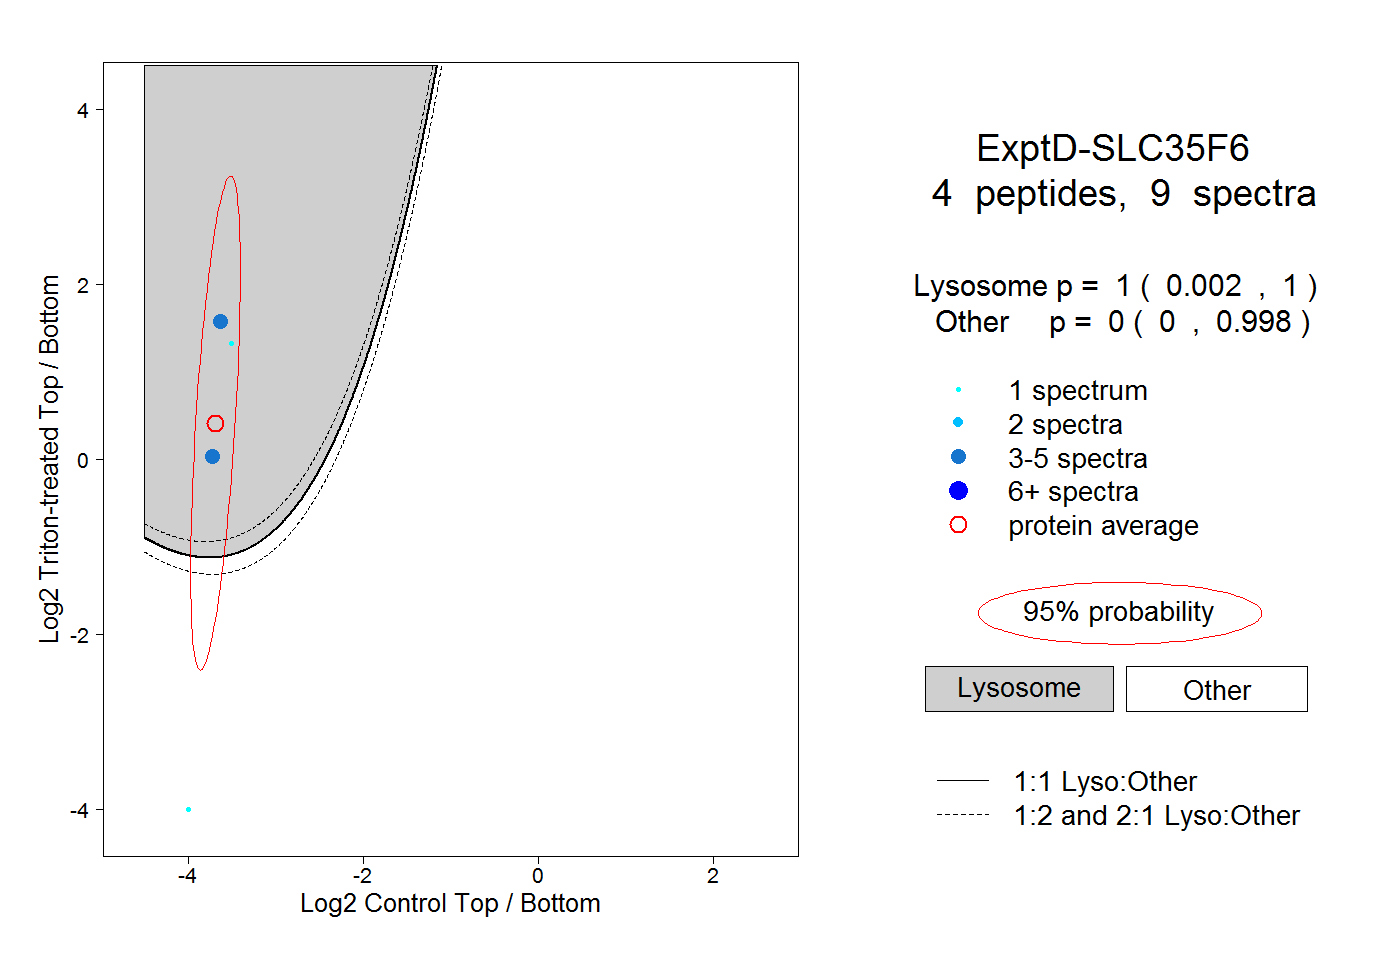
5peptides
spectra
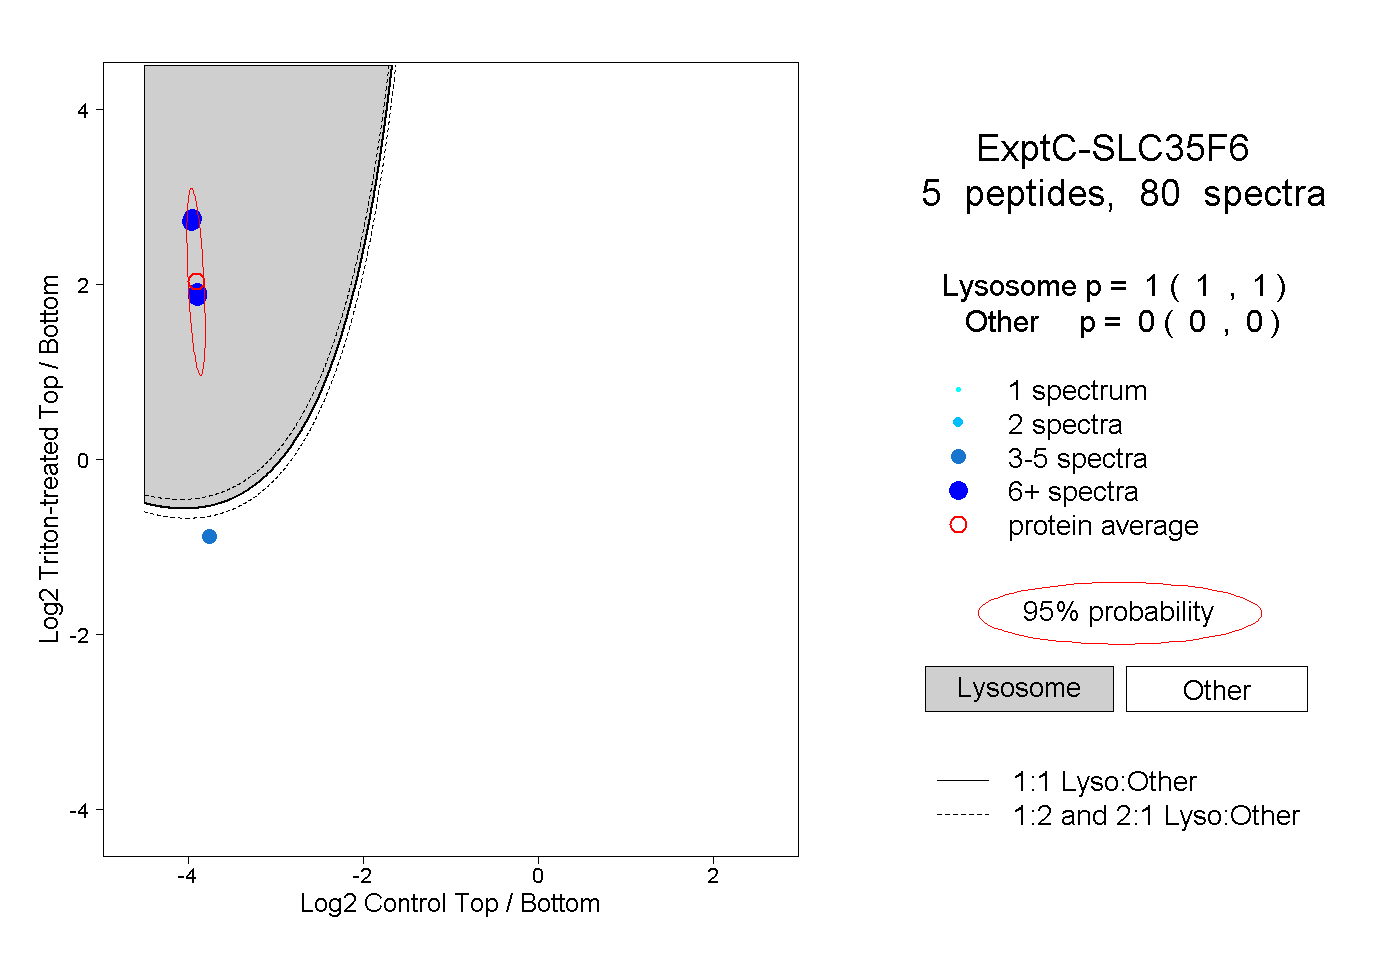
1.000 | 1.000
0.000 | 0.000