 6
6peptides
spectra

0.000 | 0.000
0.924 | 0.968
0.027 | 0.072
0.000 | 0.000
0.000 | 0.000
0.000 | 0.000
0.000 | 0.000
0.000 | 0.000
| Plot | Mito | Lyso | Perox | ER | Golgi | PM | Cytosol | Nucleus | |||||
| Expt A |
6 peptides |
24 spectra |
|
0.000 0.000 | 0.000 |
0.948 0.924 | 0.968 |
0.052 0.027 | 0.072 |
0.000 0.000 | 0.000 |
0.000 0.000 | 0.000 |
0.000 0.000 | 0.000 |
0.000 0.000 | 0.000 |
0.000 0.000 | 0.000 |
| 2 spectra, LLGDSR | 0.000 | 0.497 | 0.101 | 0.000 | 0.000 | 0.402 | 0.000 | 0.000 | ||
| 2 spectra, GVLEDALDAFCQVGR | 0.000 | 0.948 | 0.052 | 0.000 | 0.000 | 0.000 | 0.000 | 0.000 | ||
| 10 spectra, ELSATTR | 0.000 | 1.000 | 0.000 | 0.000 | 0.000 | 0.000 | 0.000 | 0.000 | ||
| 5 spectra, HPTQEGEQER | 0.000 | 0.847 | 0.153 | 0.000 | 0.000 | 0.000 | 0.000 | 0.000 | ||
| 4 spectra, QSDSSVEPR | 0.000 | 1.000 | 0.000 | 0.000 | 0.000 | 0.000 | 0.000 | 0.000 | ||
| 1 spectrum, MVLDTLR | 0.000 | 0.860 | 0.000 | 0.000 | 0.000 | 0.116 | 0.024 | 0.000 |
| Plot | Mito | Lyso or Perox | ER | Golgi | PM | Cytosol | Nucleus | ||||||
| Expt B |
6 peptides |
19 spectra |
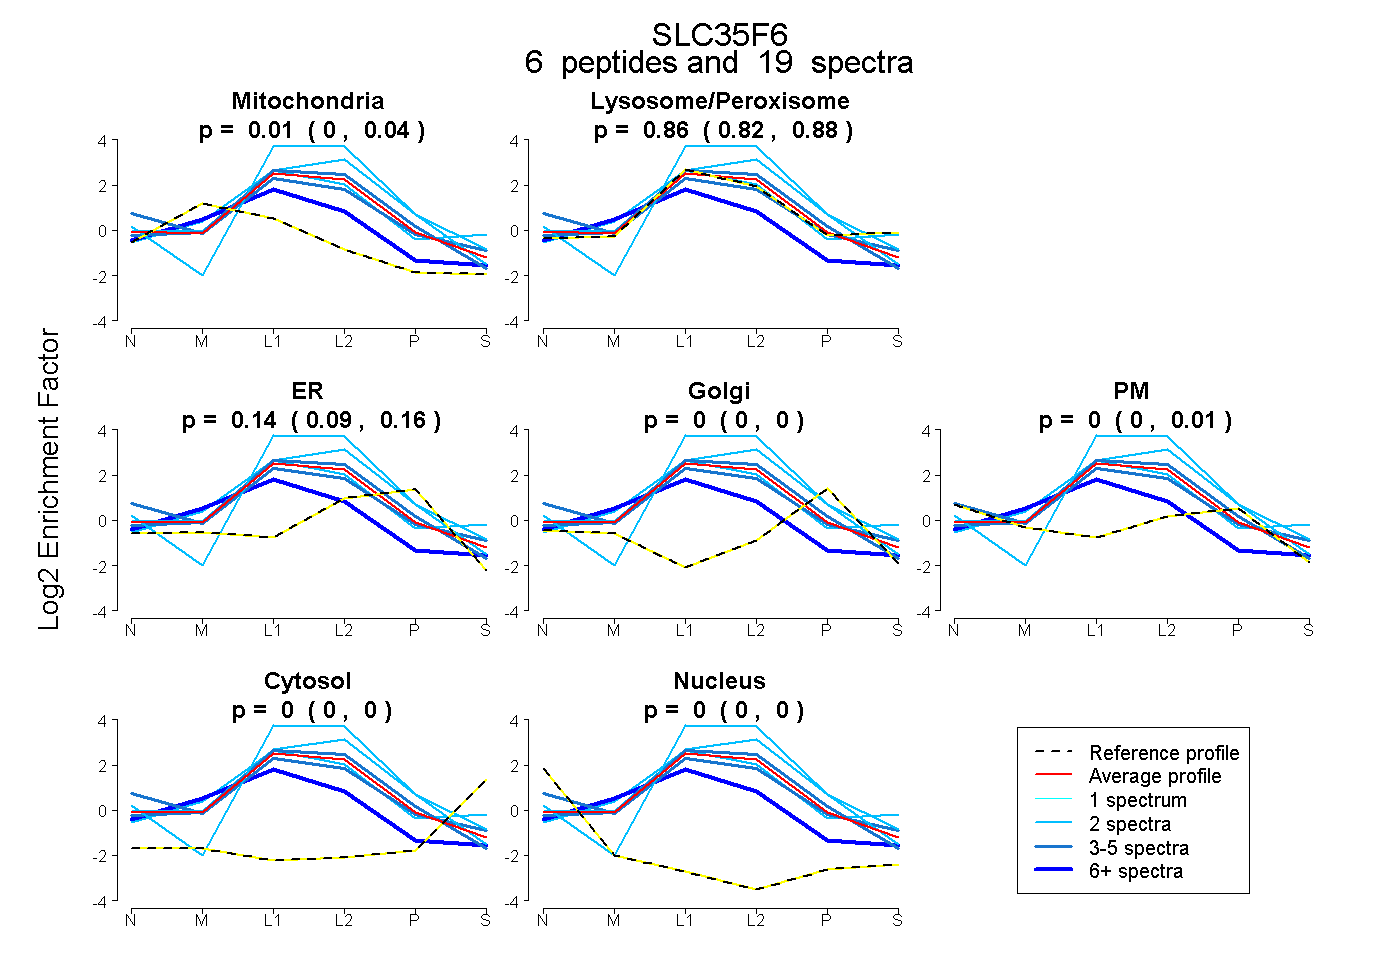 |
0.006 0.000 | 0.041 |
0.859 0.823 | 0.883 |
0.135 0.092 | 0.158 |
0.000 0.000 | 0.000 |
0.000 0.000 | 0.010 |
0.000 0.000 | 0.000 |
0.000 0.000 | 0.000 |
|||
| Plot | Lyso | Other | |||||||||||
| Expt C |
5 peptides |
80 spectra |
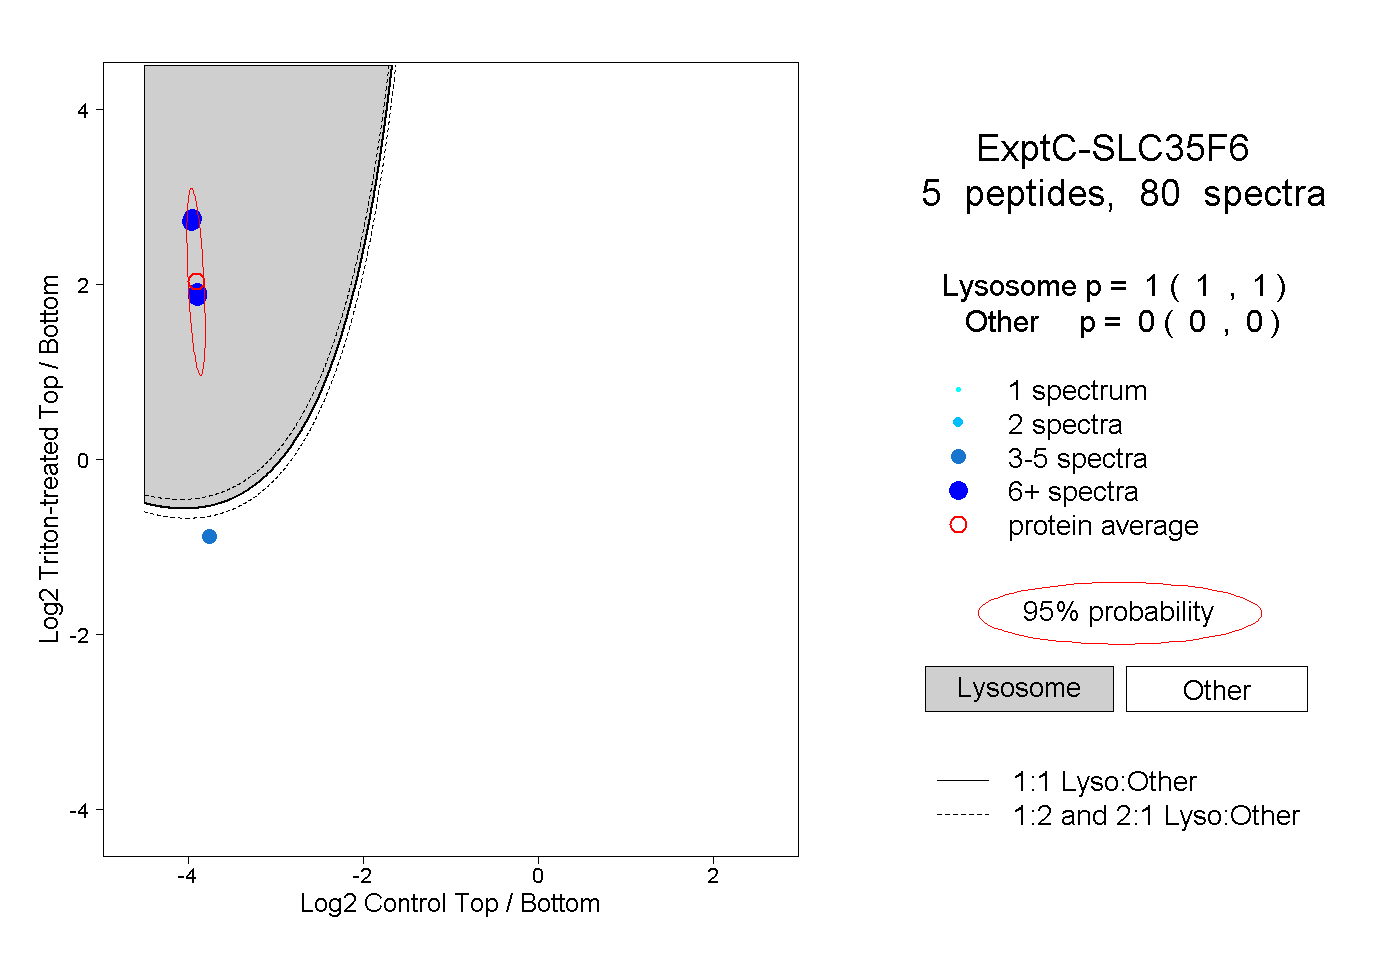 |
1.000 1.000 | 1.000 |
0.000 0.000 | 0.000 |
||||||||
| Plot | Lyso | Other | |||||||||||
| Expt D |
4 peptides |
9 spectra |
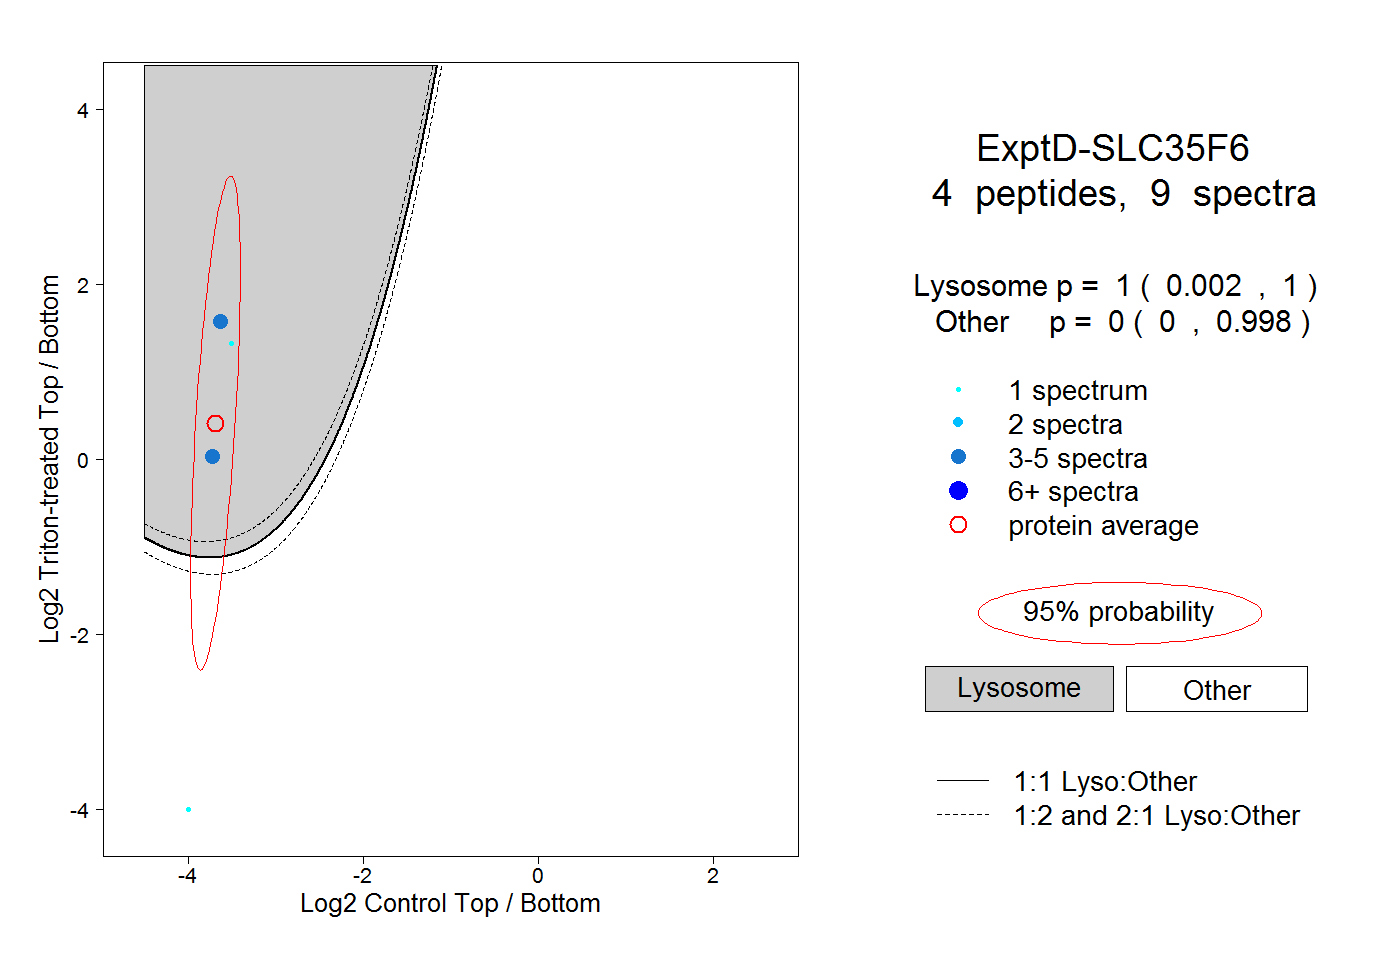 |
1.000 0.002 | 1.000 |
0.000 0.000 | 0.998 |