 11
11peptides
spectra
0.000 | 0.000
0.000 | 0.000
0.000 | 0.000
0.352 | 0.422
0.134 | 0.215
0.000 | 0.000
0.369 | 0.389
0.040 | 0.060
| Plot | Mito | Lyso | Perox | ER | Golgi | PM | Cytosol | Nucleus | |||||
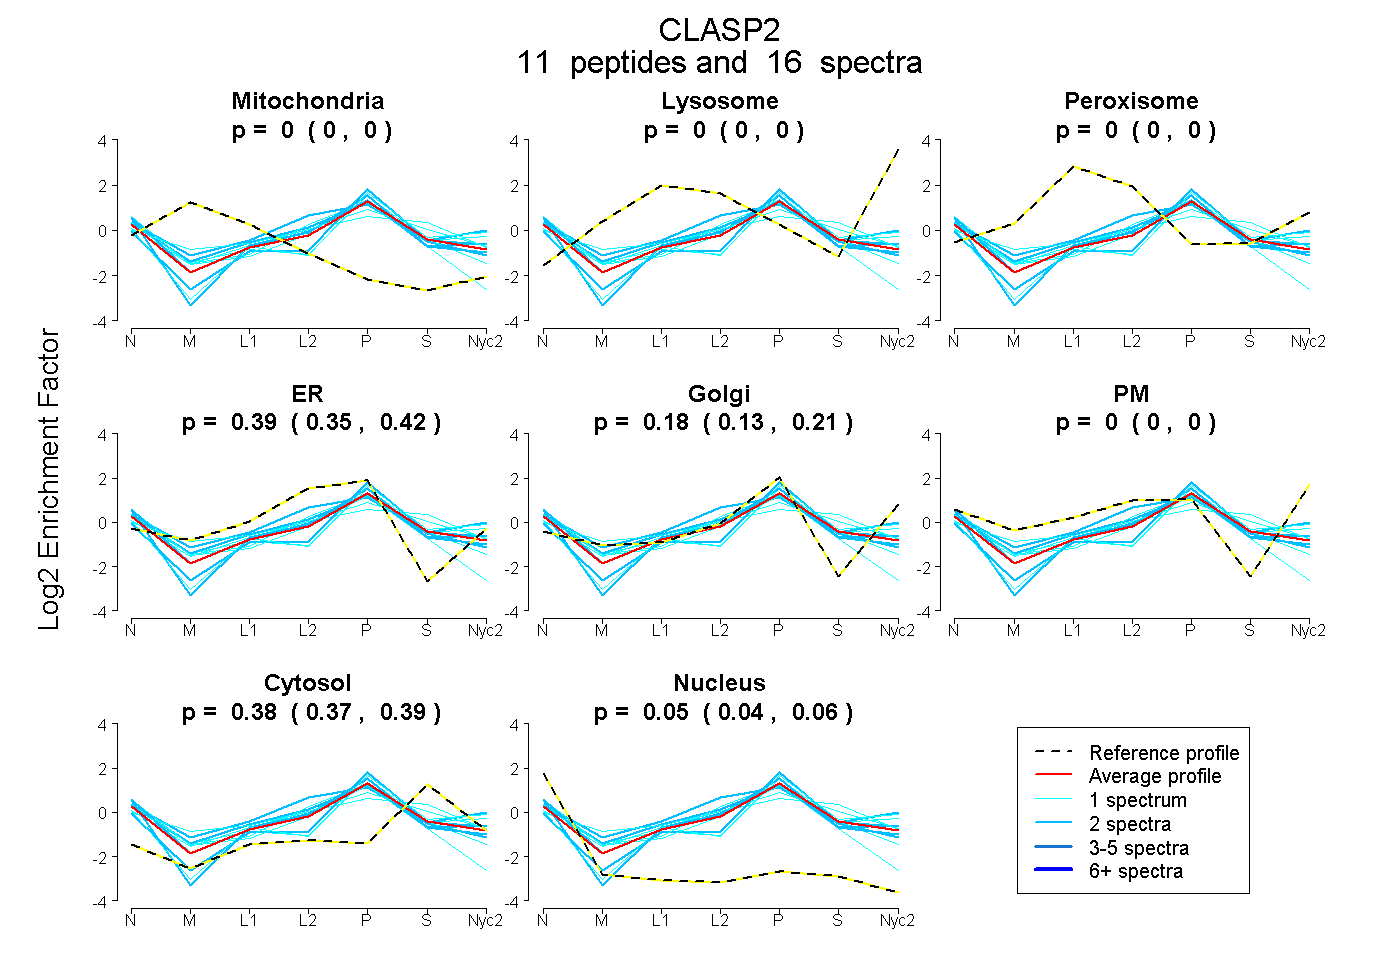
| Expt A |
11 peptides |
16 spectra |
|
0.000 0.000 | 0.000 |
0.000 0.000 | 0.000 |
0.000 0.000 | 0.000 |
0.390 0.352 | 0.422 |
0.179 0.134 | 0.215 |
0.000 0.000 | 0.000 |
0.380 0.369 | 0.389 |
0.051 0.040 | 0.060 |
| 2 spectra, EGGAGAVDEDDFIK | 0.000 | 0.000 | 0.000 | 0.591 | 0.000 | 0.000 | 0.352 | 0.057 | ||
| 1 spectrum, LCEIFTR | 0.000 | 0.000 | 0.000 | 0.524 | 0.000 | 0.000 | 0.232 | 0.244 | ||
| 2 spectra, QTEDVAEVLNR | 0.000 | 0.000 | 0.000 | 0.381 | 0.226 | 0.018 | 0.301 | 0.075 | ||
| 1 spectrum, ASPLPGSLQR | 0.000 | 0.000 | 0.000 | 0.000 | 0.631 | 0.000 | 0.341 | 0.029 | ||
| 2 spectra, LLHNHLR | 0.000 | 0.000 | 0.000 | 0.432 | 0.125 | 0.000 | 0.339 | 0.104 | ||
| 1 spectrum, ILVNSASAQK | 0.000 | 0.000 | 0.022 | 0.389 | 0.000 | 0.045 | 0.543 | 0.000 | ||
| 1 spectrum, SLLVAGAAQYDCFFQHLR | 0.001 | 0.000 | 0.060 | 0.429 | 0.053 | 0.018 | 0.439 | 0.000 | ||
| 1 spectrum, TPGNPVNSAR | 0.000 | 0.000 | 0.000 | 0.000 | 0.570 | 0.000 | 0.419 | 0.011 | ||
| 2 spectra, HTHVPR | 0.000 | 0.000 | 0.008 | 0.373 | 0.000 | 0.292 | 0.327 | 0.000 | ||
| 2 spectra, IPRPSVSQGCSR | 0.000 | 0.000 | 0.000 | 0.023 | 0.563 | 0.000 | 0.374 | 0.040 | ||
| 1 spectrum, LIPLITSNCTSK | 0.000 | 0.000 | 0.000 | 0.565 | 0.000 | 0.000 | 0.343 | 0.091 |
| Plot | Mito | Lyso or Perox | ER | Golgi | PM | Cytosol | Nucleus | ||||||
| Expt B |
2 peptides |
2 spectra |
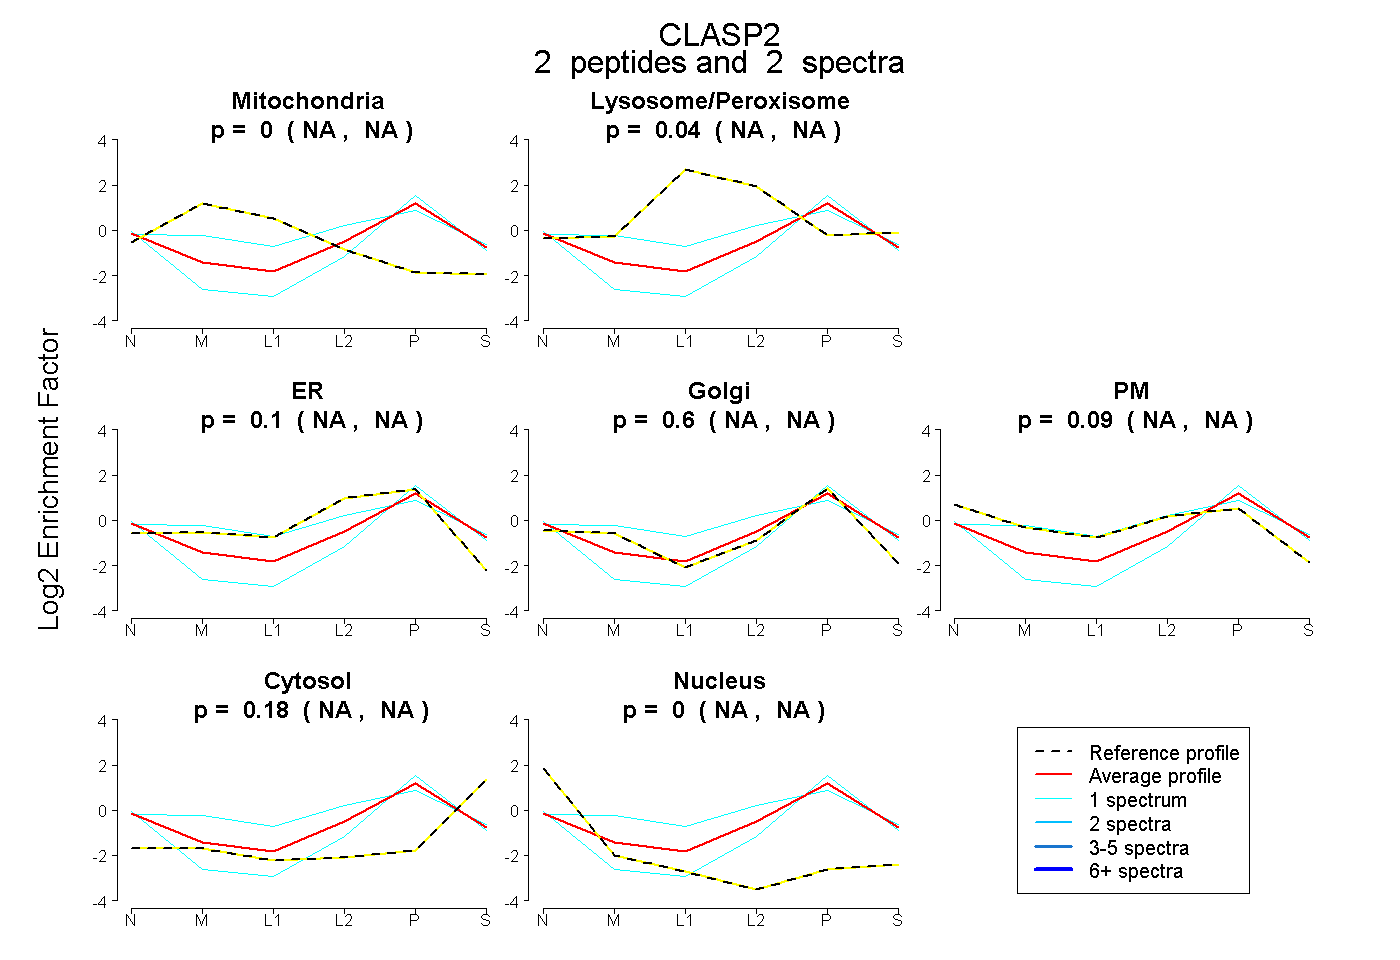 |
0.000 NA | NA |
0.037 NA | NA |
0.096 NA | NA |
0.598 NA | NA |
0.089 NA | NA |
0.179 NA | NA |
0.000 NA | NA |
|||
| Plot | Lyso | Other | |||||||||||
| Expt C |
8 peptides |
14 spectra |
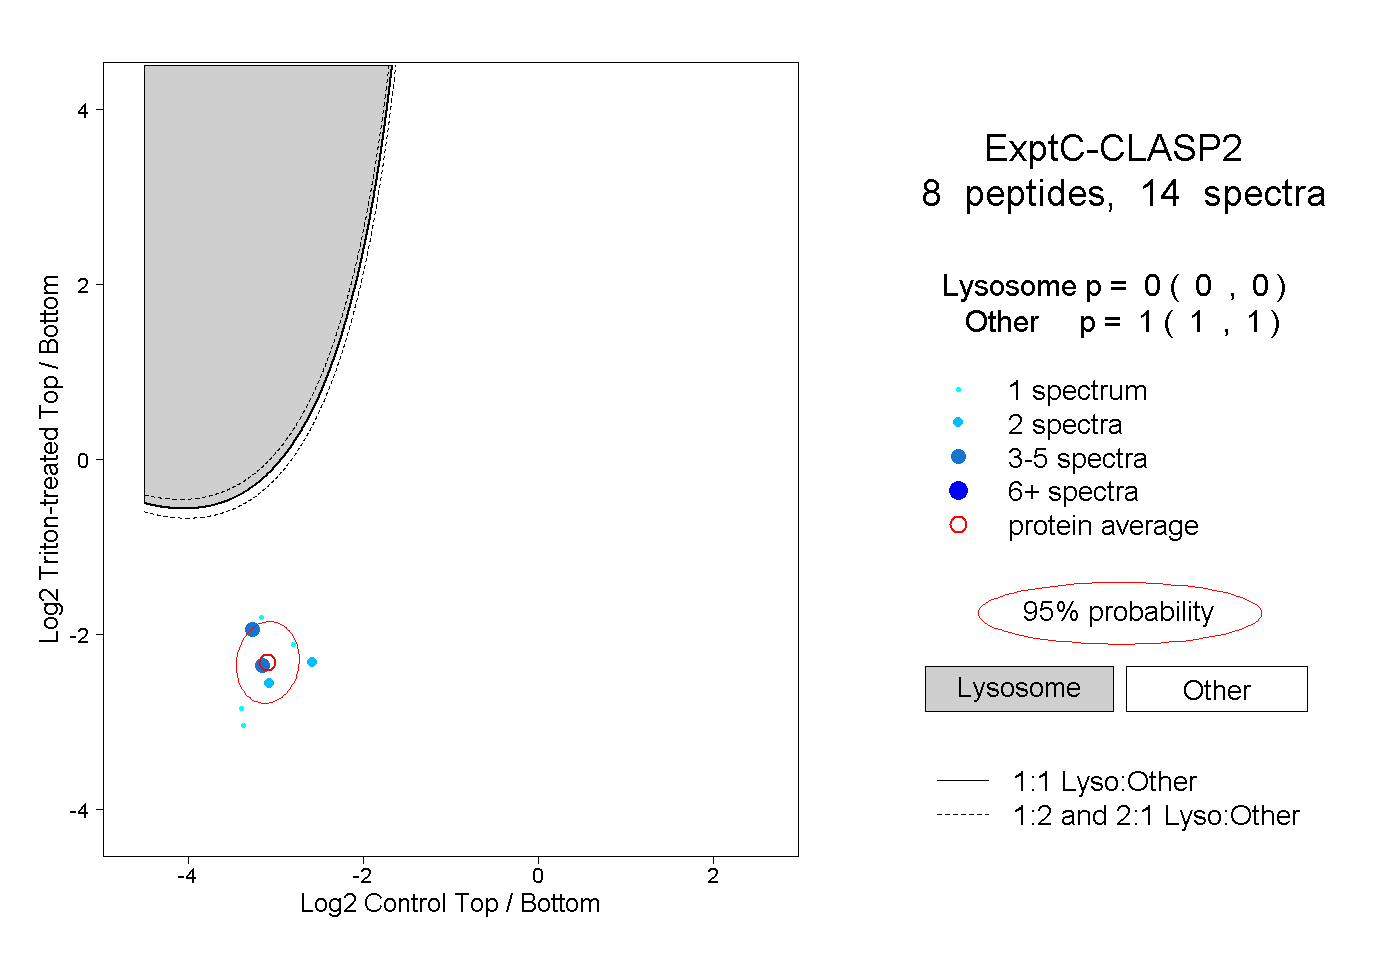 |
0.000 0.000 | 0.000 |
1.000 1.000 | 1.000 |