 18
18peptides
spectra
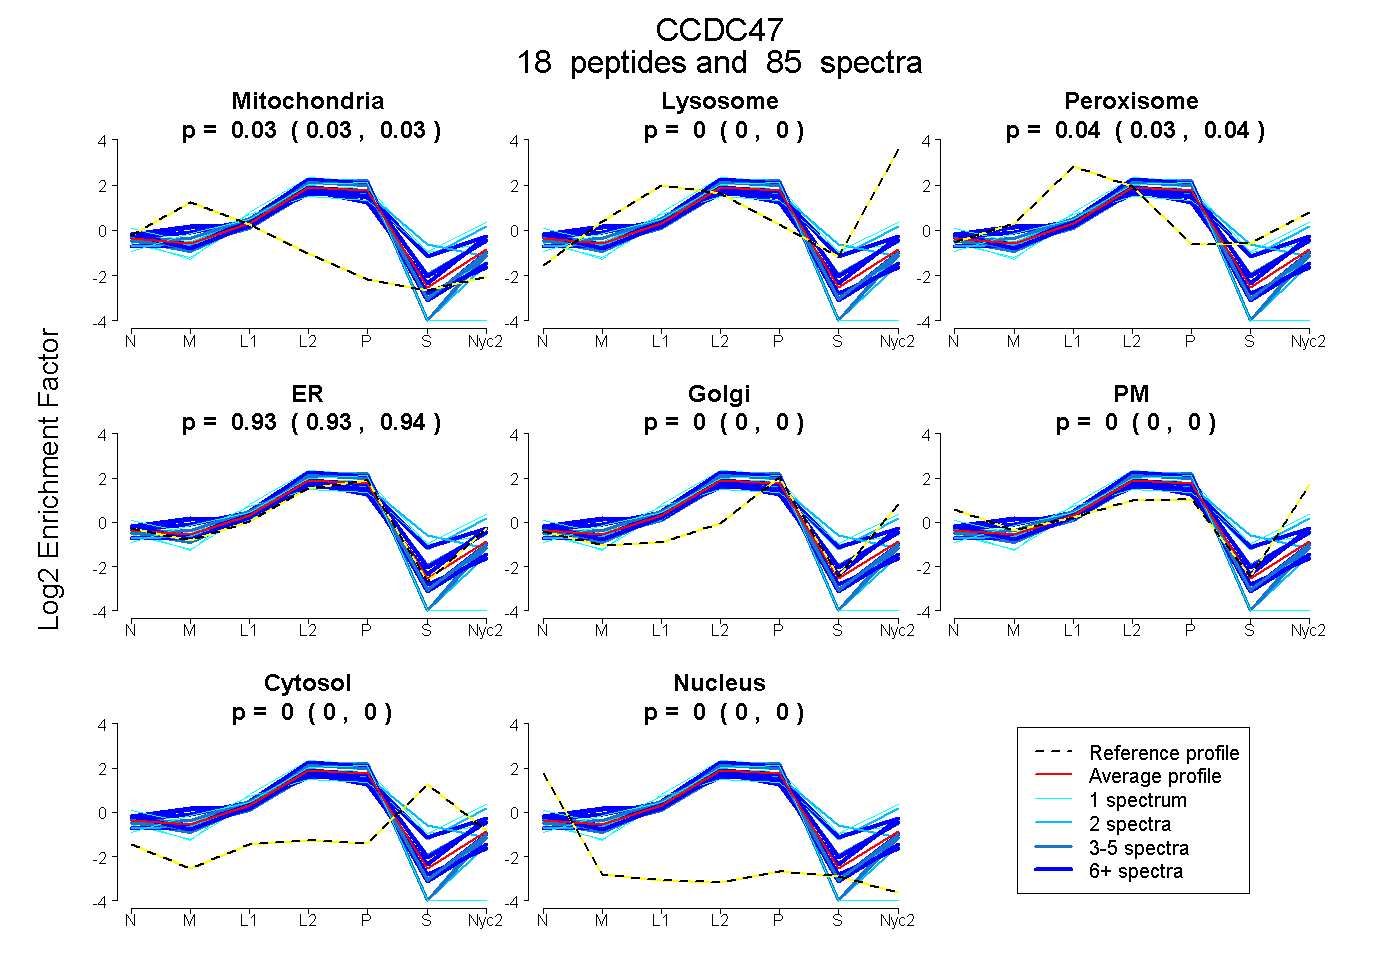
0.025 | 0.034
0.000 | 0.000
0.032 | 0.045
0.926 | 0.936
0.000 | 0.000
0.000 | 0.000
0.000 | 0.000
0.000 | 0.000
5peptides
spectra
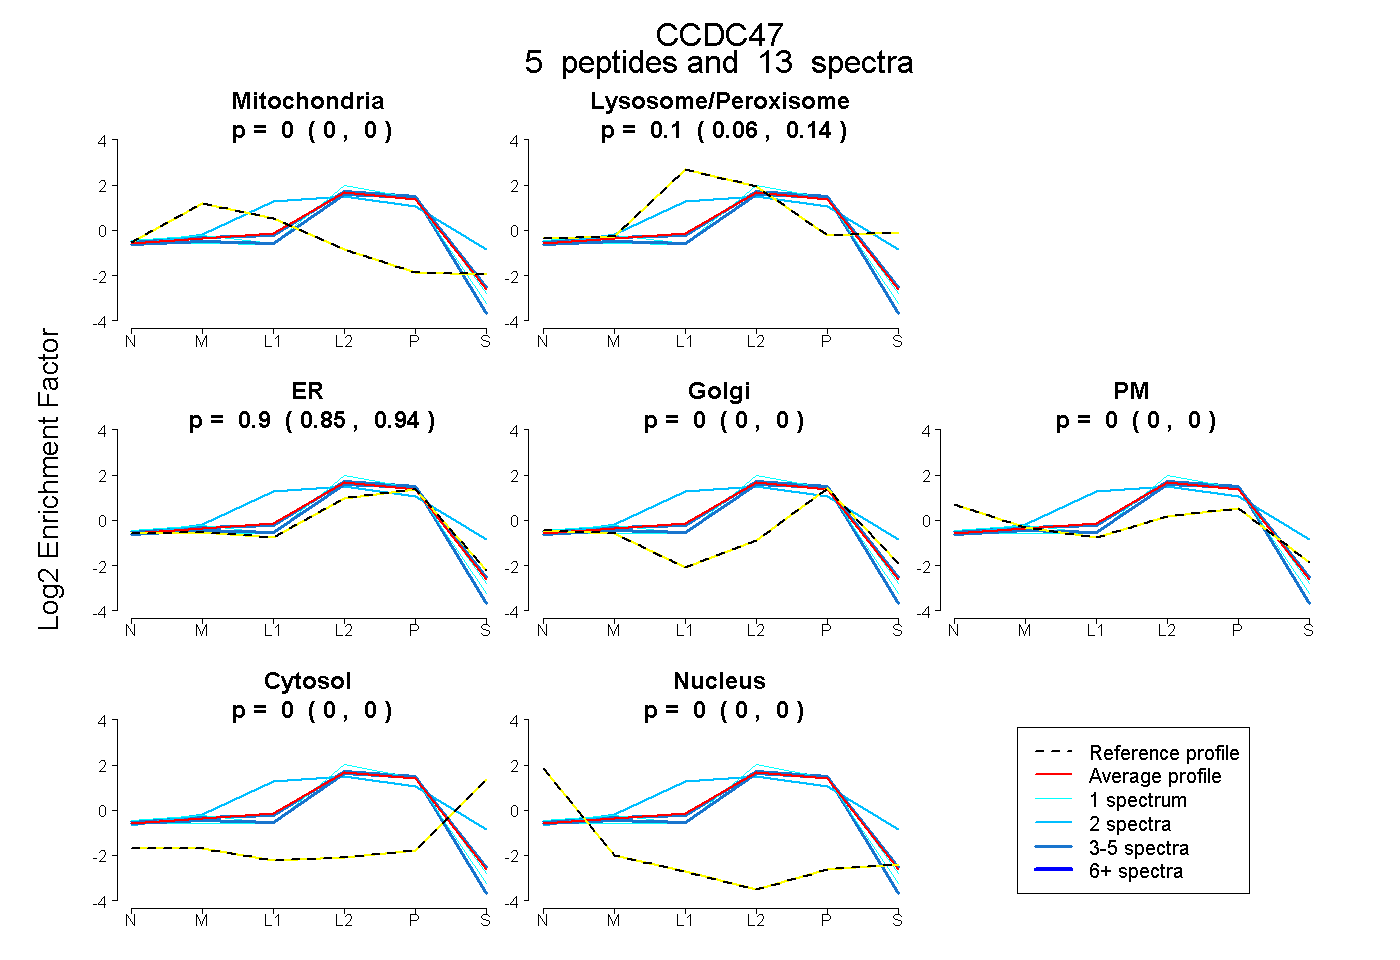
0.000 | 0.000
0.055 | 0.139
0.853 | 0.938
0.000 | 0.000
0.000 | 0.000
0.000 | 0.000
0.000 | 0.000
14peptides
spectra
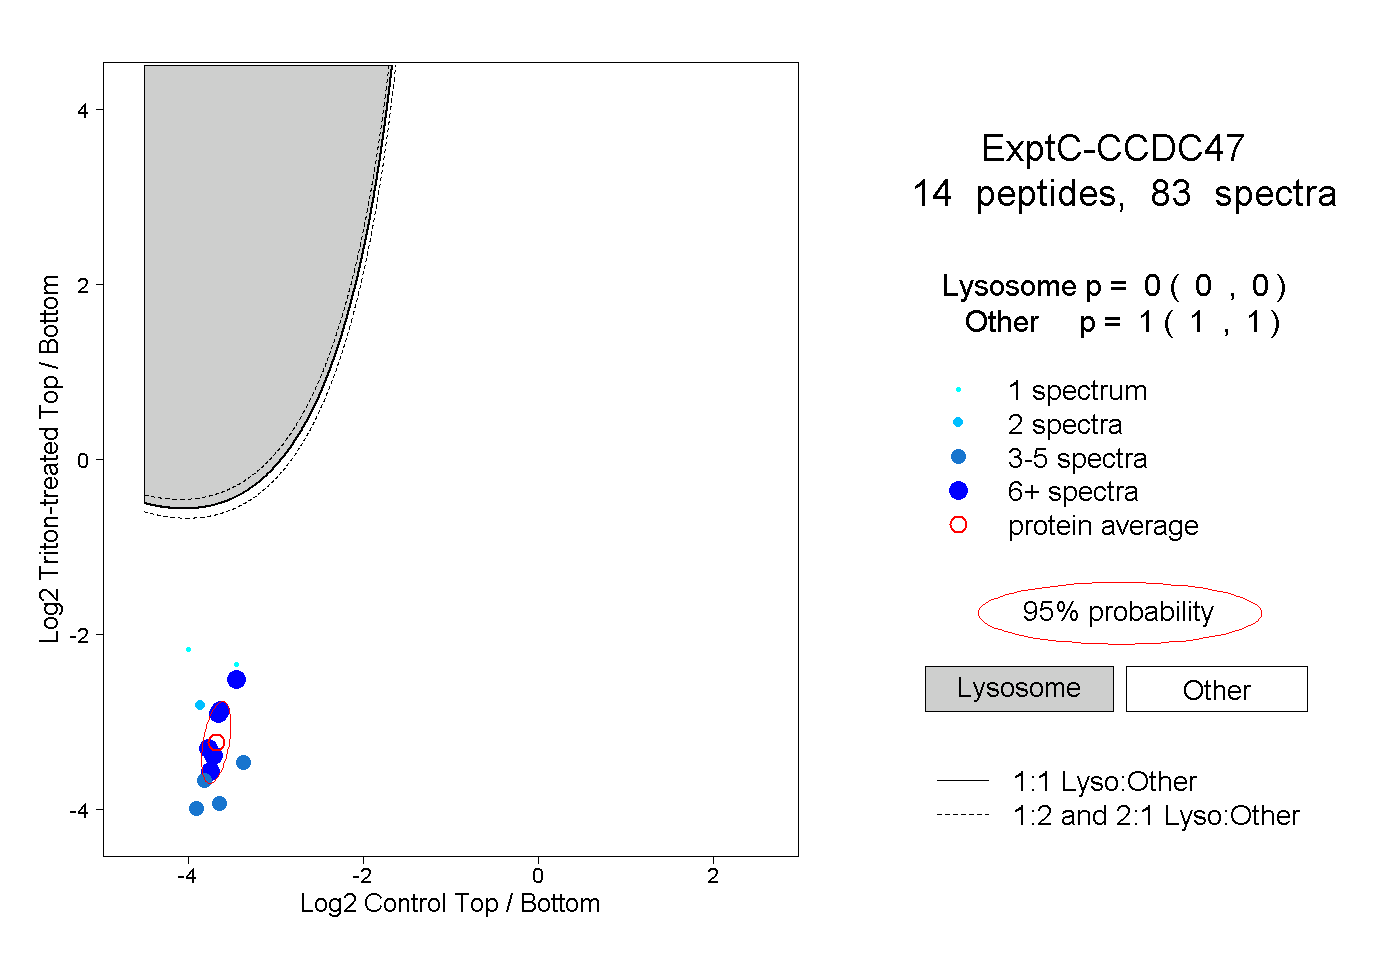
0.000 | 0.000
1.000 | 1.000
3peptides
spectra
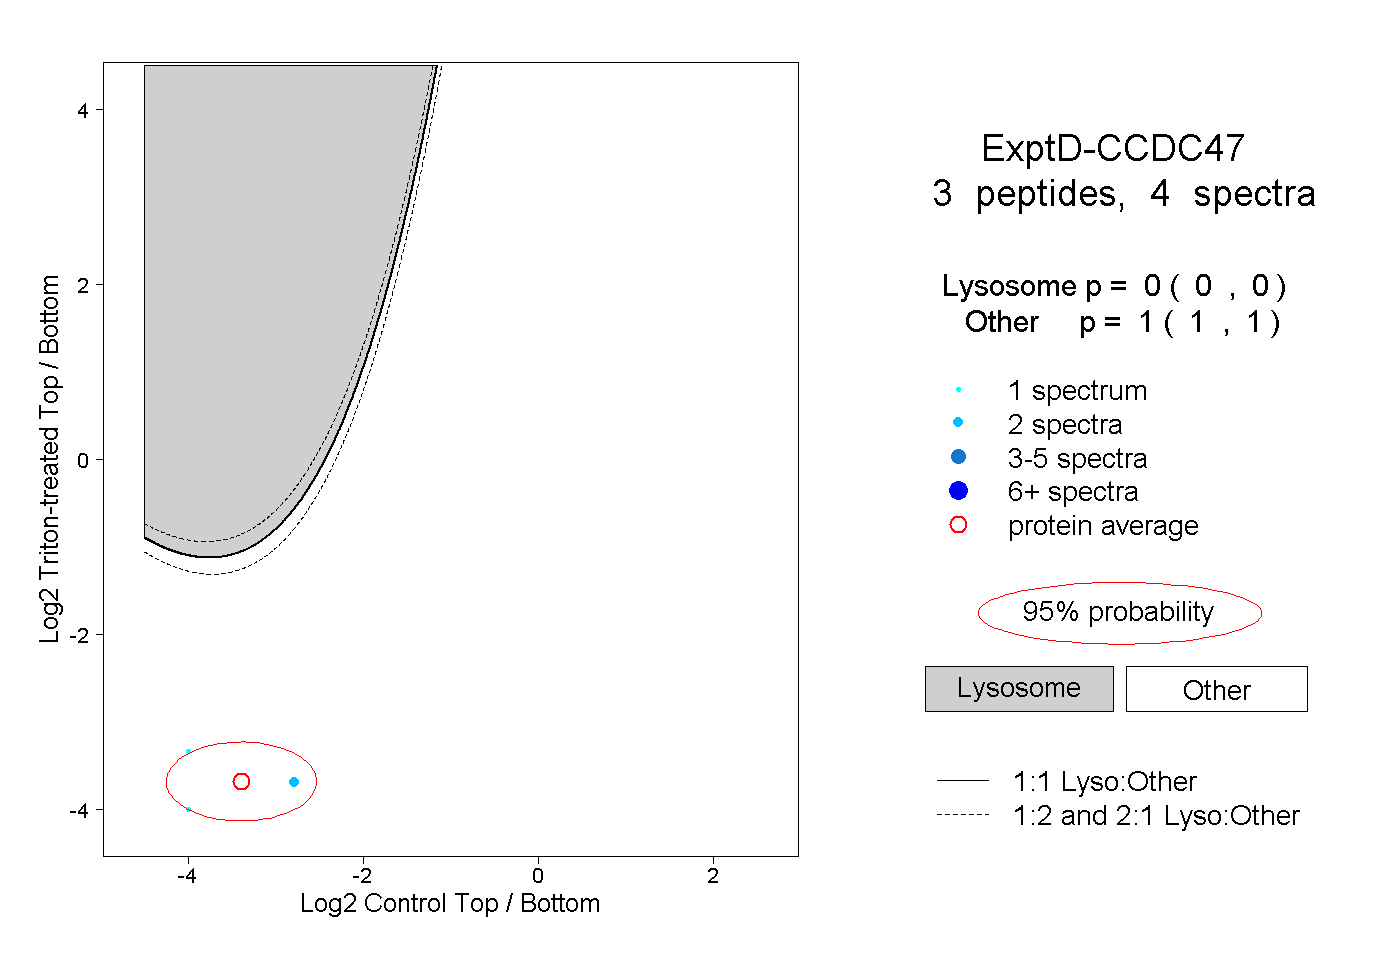
0.000 | 0.000
1.000 | 1.000