 4
4peptides
spectra
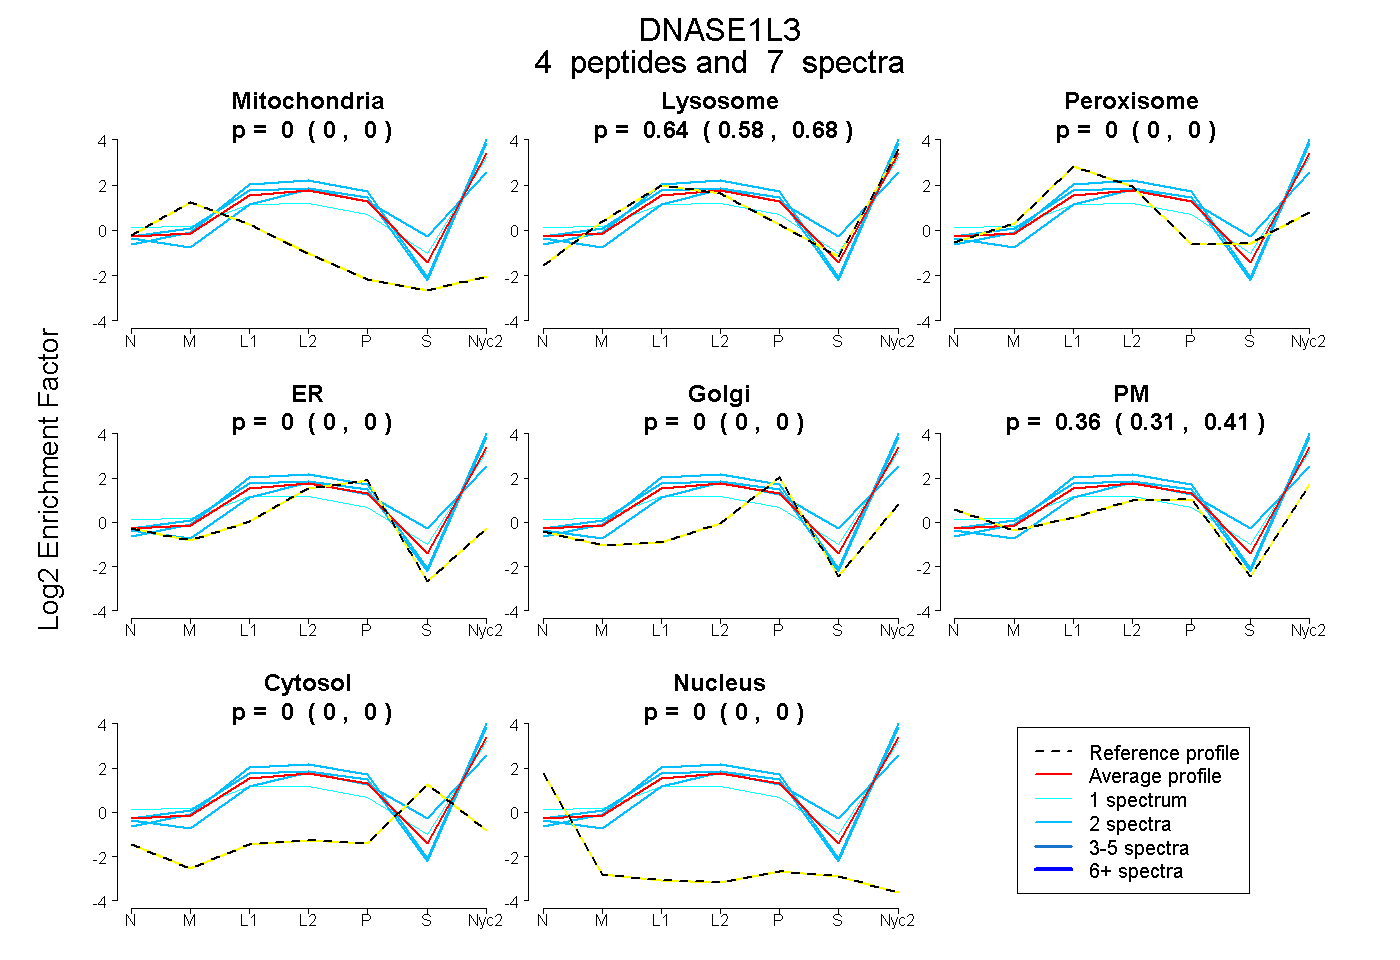
0.000 | 0.000
0.584 | 0.684
0.000 | 0.000
0.000 | 0.000
0.000 | 0.000
0.310 | 0.408
0.000 | 0.000
0.000 | 0.000
4peptides
spectra
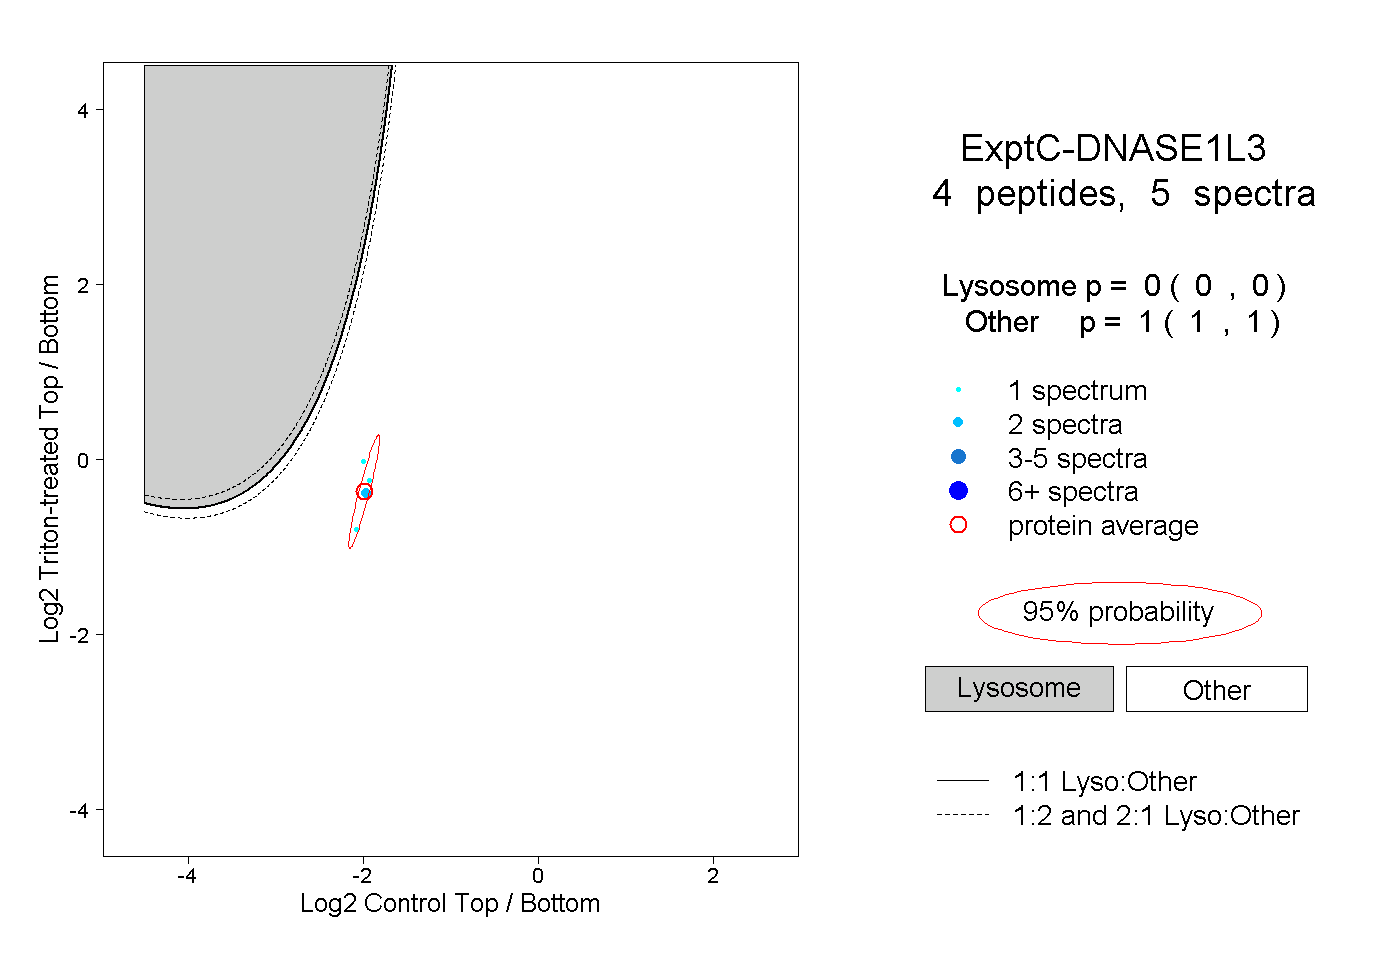
0.000 | 0.000
1.000 | 1.000
2peptides
spectra
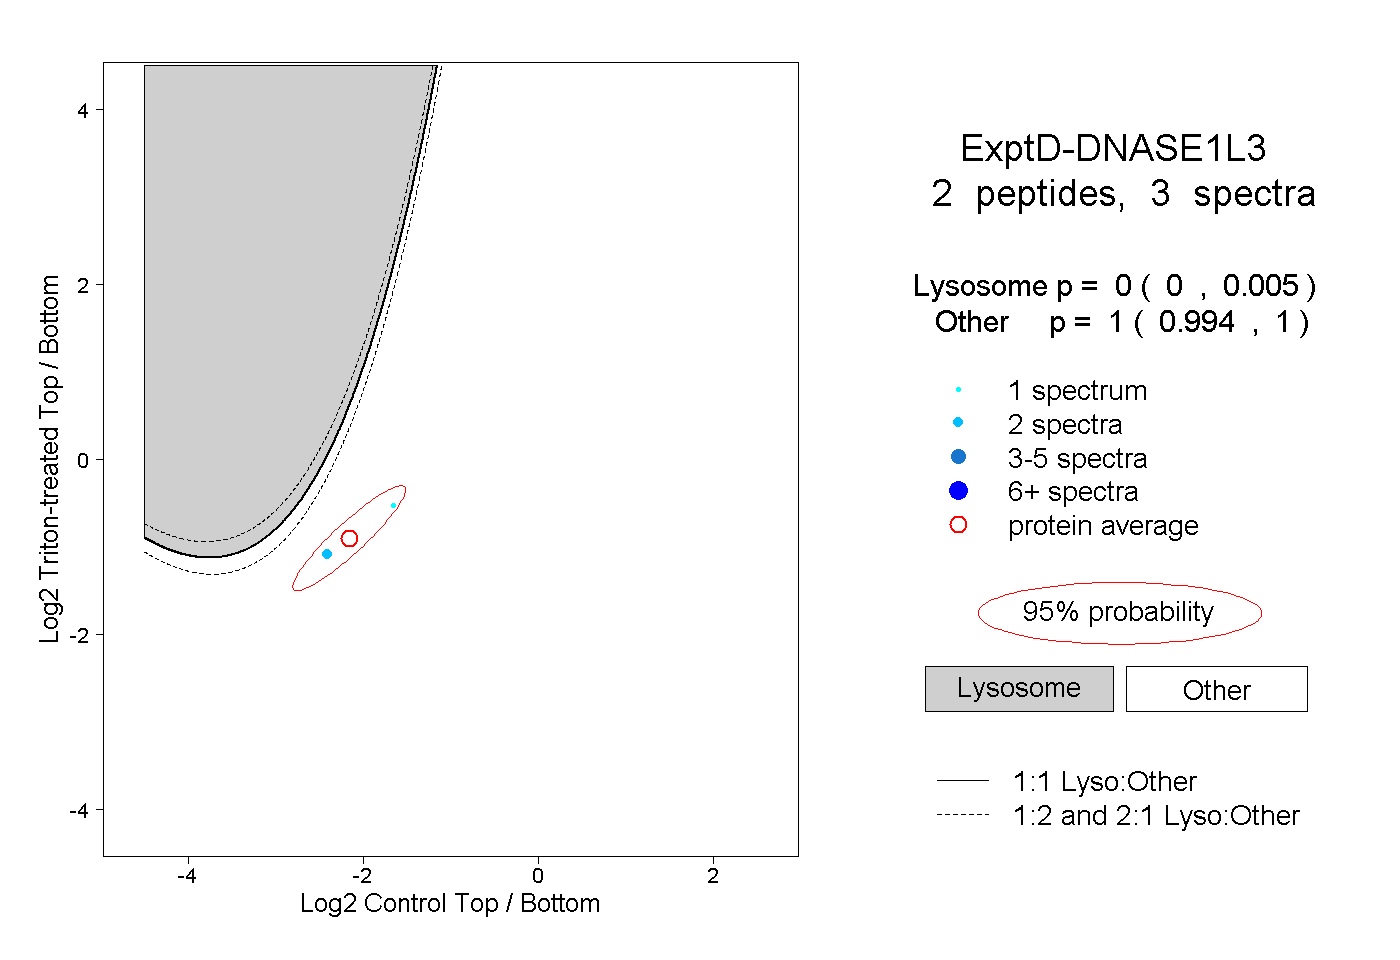
0.000 | 0.005
0.994 | 1.000