 1
1peptide
spectra
0.000 | 0.028
0.000 | 0.051
0.099 | 0.258
0.000 | 0.149
0.321 | 0.592
0.000 | 0.250
0.082 | 0.188
0.000 | 0.000
1peptide
spectrum
NA | NA
NA | NA
| Plot | Mito | Lyso | Perox | ER | Golgi | PM | Cytosol | Nucleus | |||||
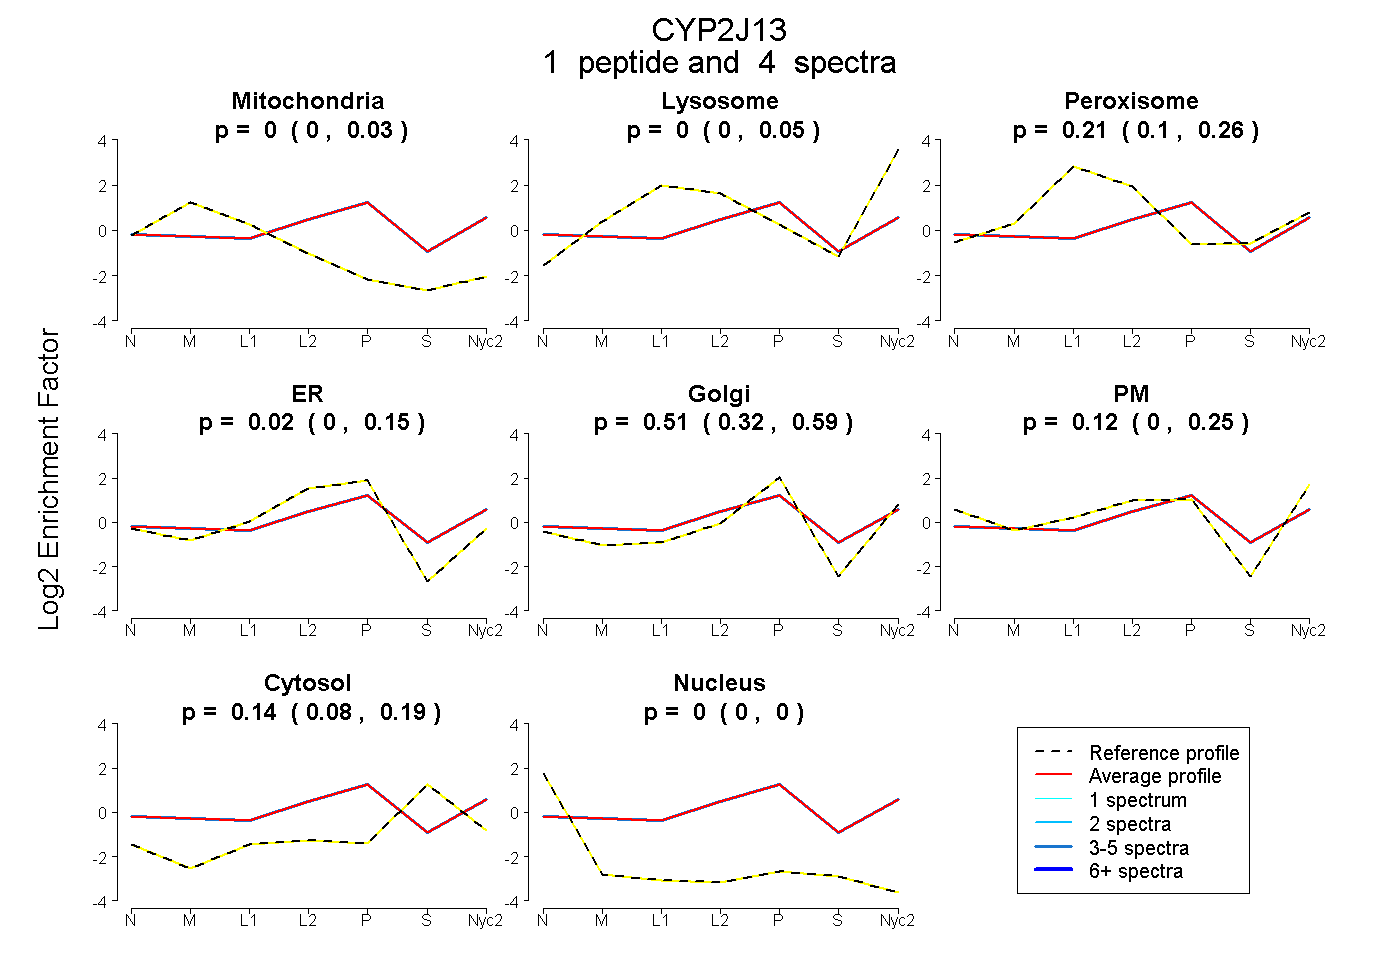
| Expt A |
1 peptide |
4 spectra |
|
0.000 0.000 | 0.028 |
0.000 0.000 | 0.051 |
0.212 0.099 | 0.258 |
0.016 0.000 | 0.149 |
0.511 0.321 | 0.592 |
0.122 0.000 | 0.250 |
0.139 0.082 | 0.188 |
0.000 0.000 | 0.000 |
||
| Plot | Lyso | Other | |||||||||||
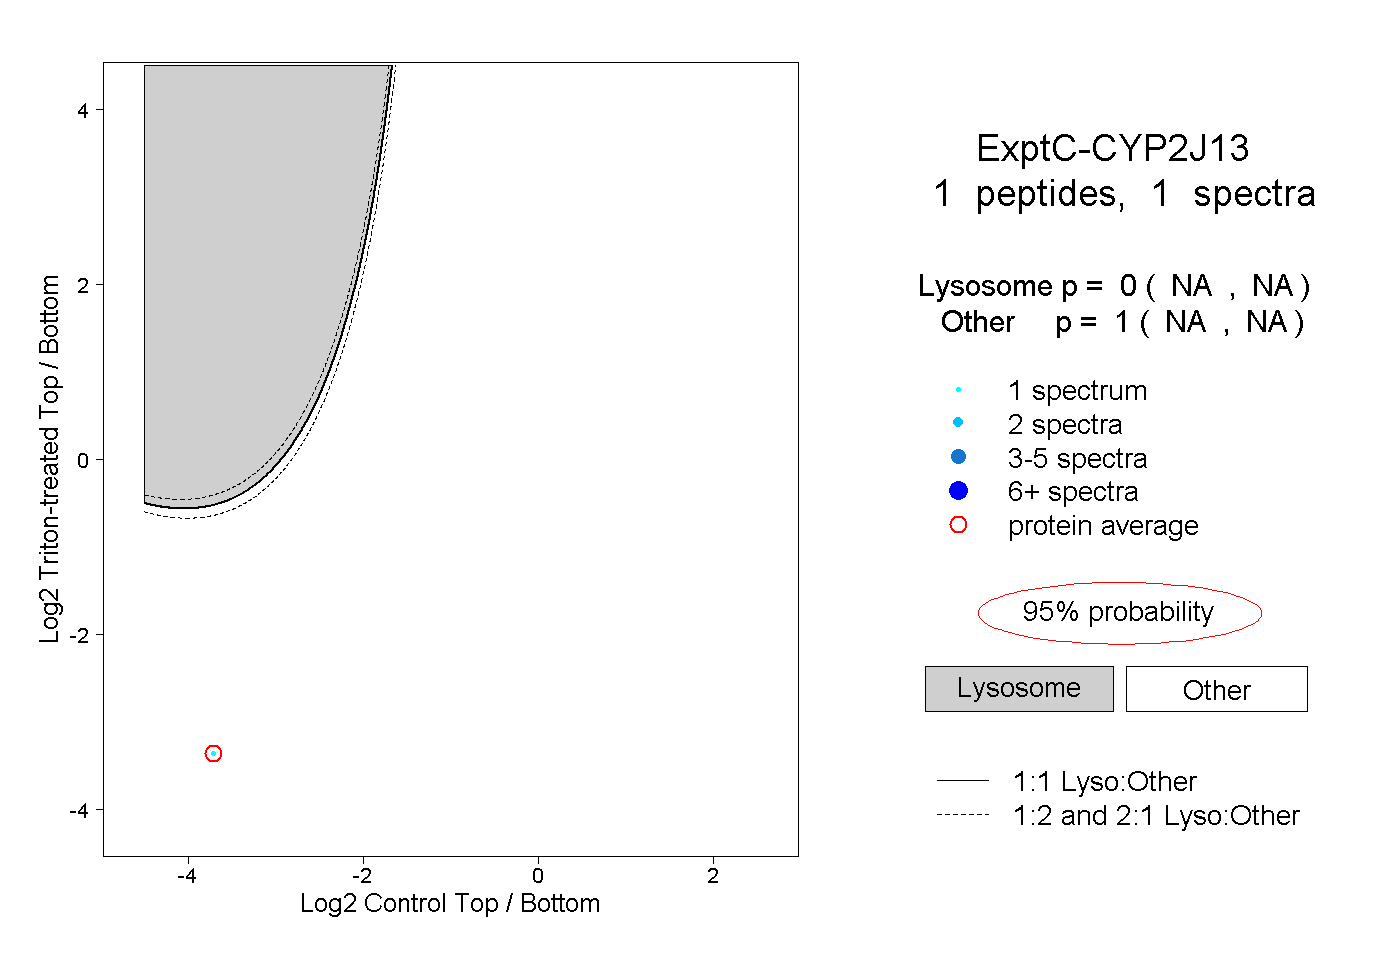
| Expt C |
1 peptide |
1 spectrum |
|
0.000 NA | NA |
1.000 NA | NA |