 3
3peptides
spectra
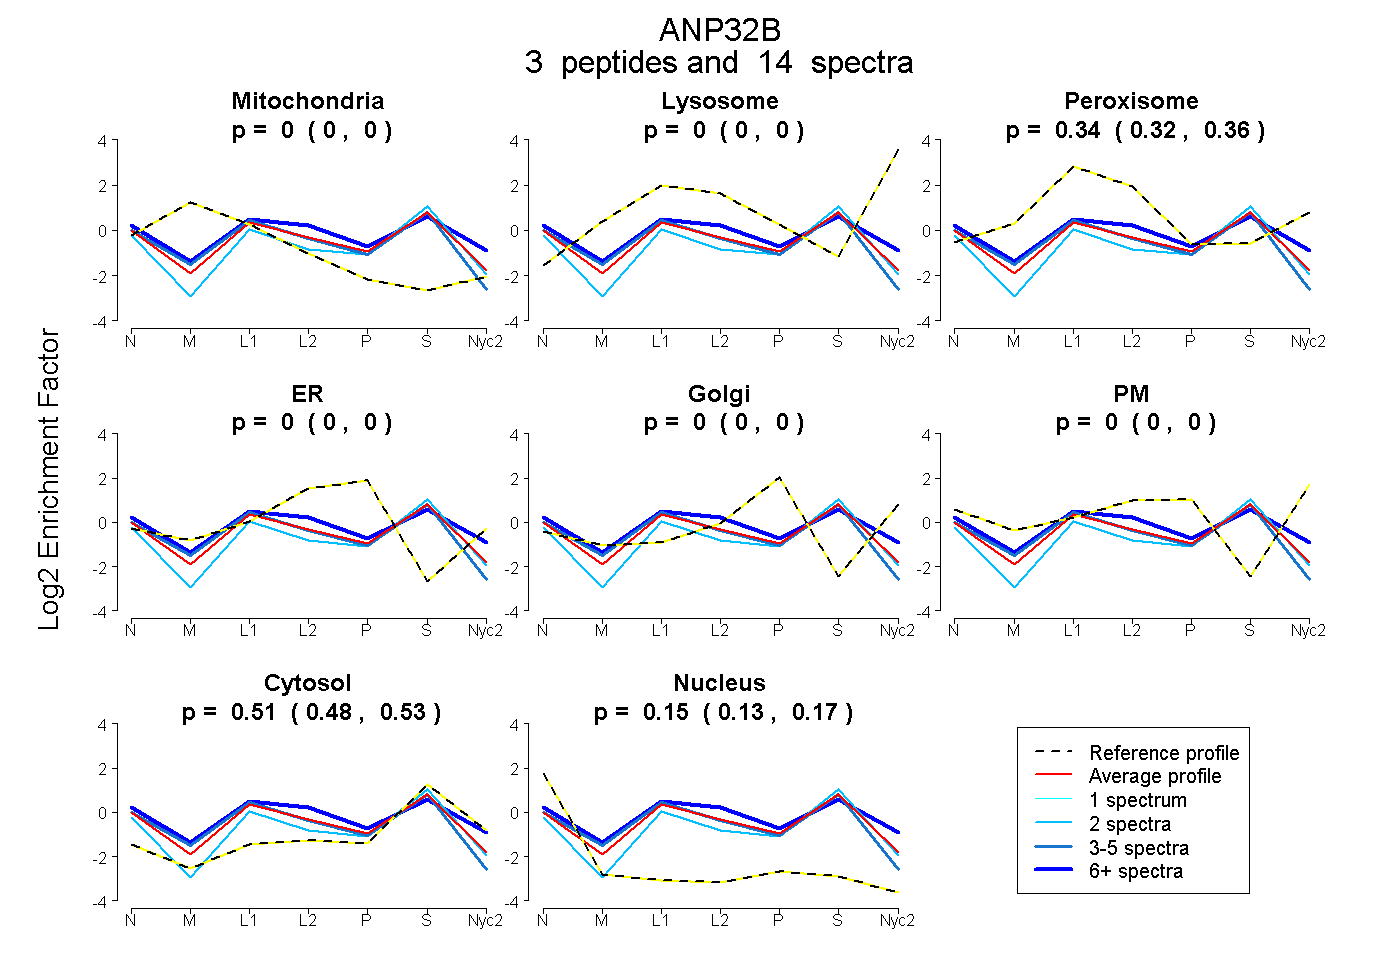
0.000 | 0.000
0.000 | 0.000
0.315 | 0.357
0.000 | 0.000
0.000 | 0.000
0.000 | 0.000
0.483 | 0.532
0.134 | 0.170
2peptides
spectra
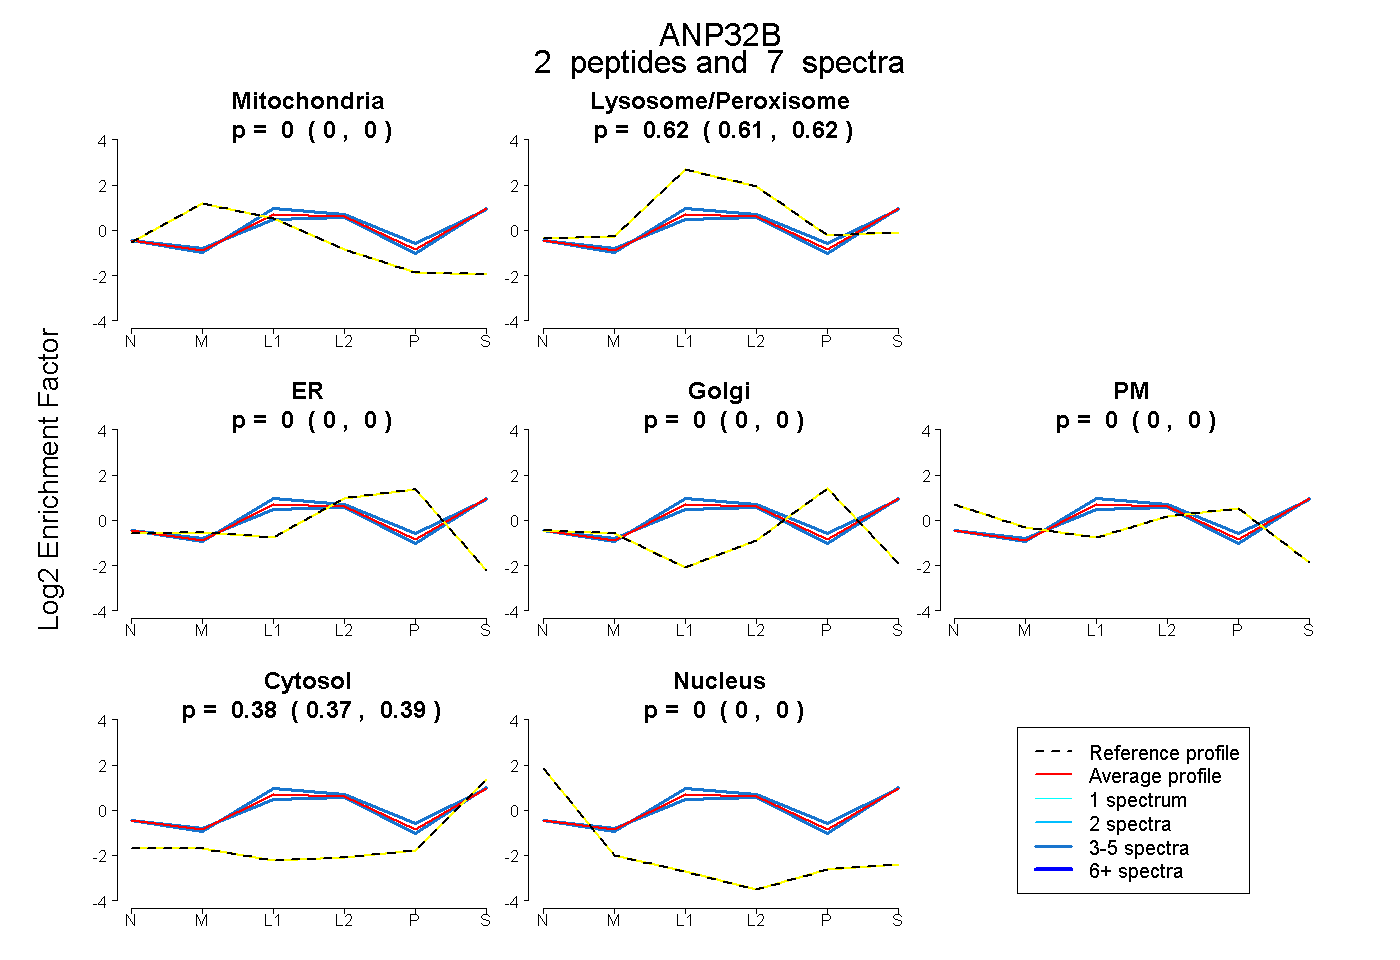
0.000 | 0.000
0.606 | 0.625
0.000 | 0.000
0.000 | 0.000
0.000 | 0.000
0.374 | 0.393
0.000 | 0.000
4peptides
spectra
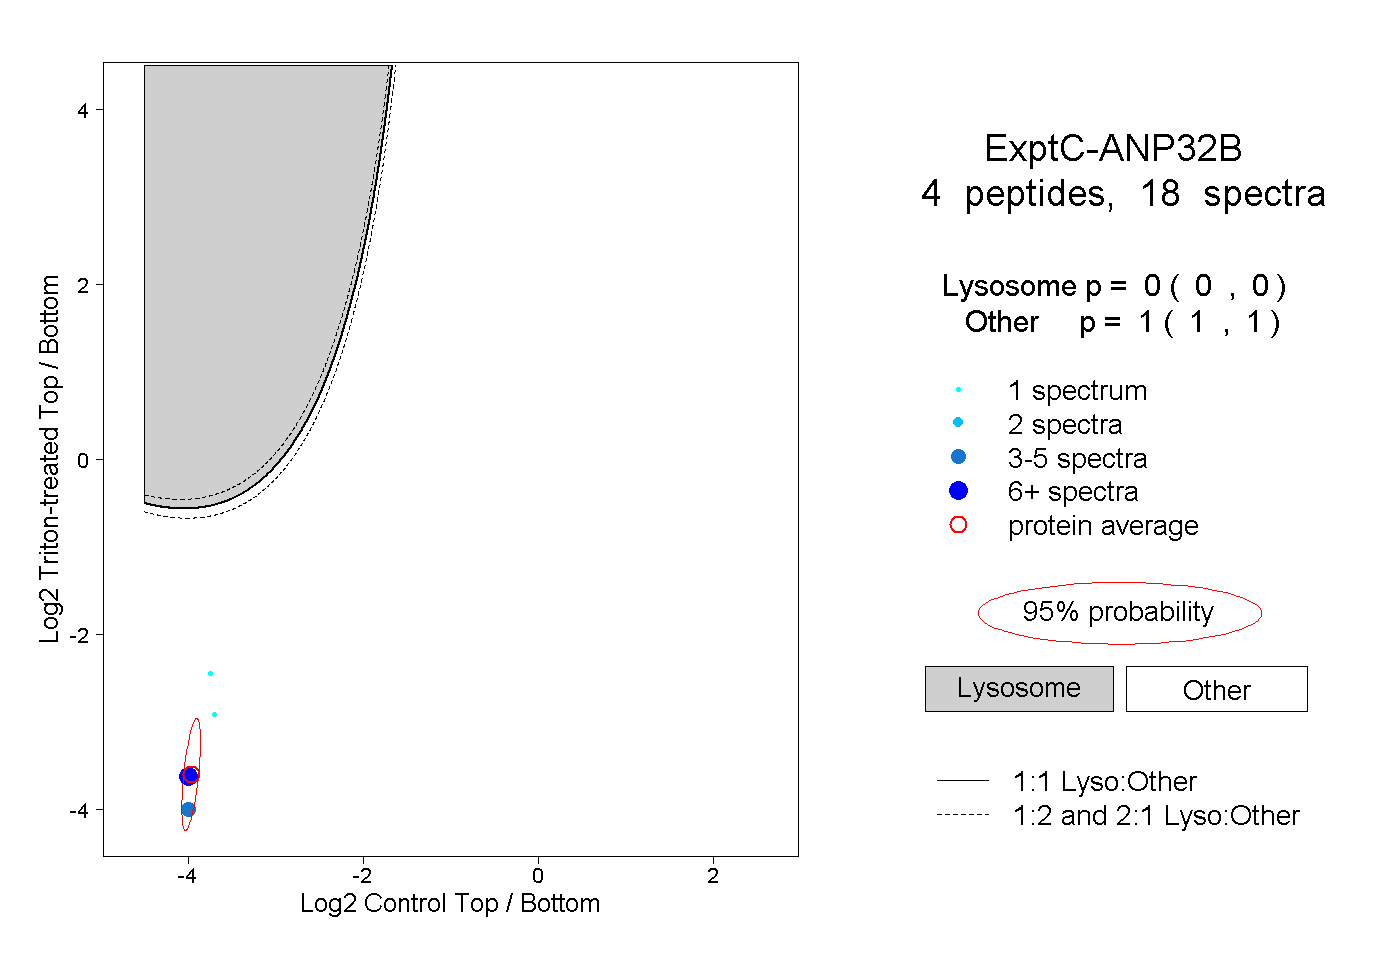
0.000 | 0.000
1.000 | 1.000
1peptide
spectra
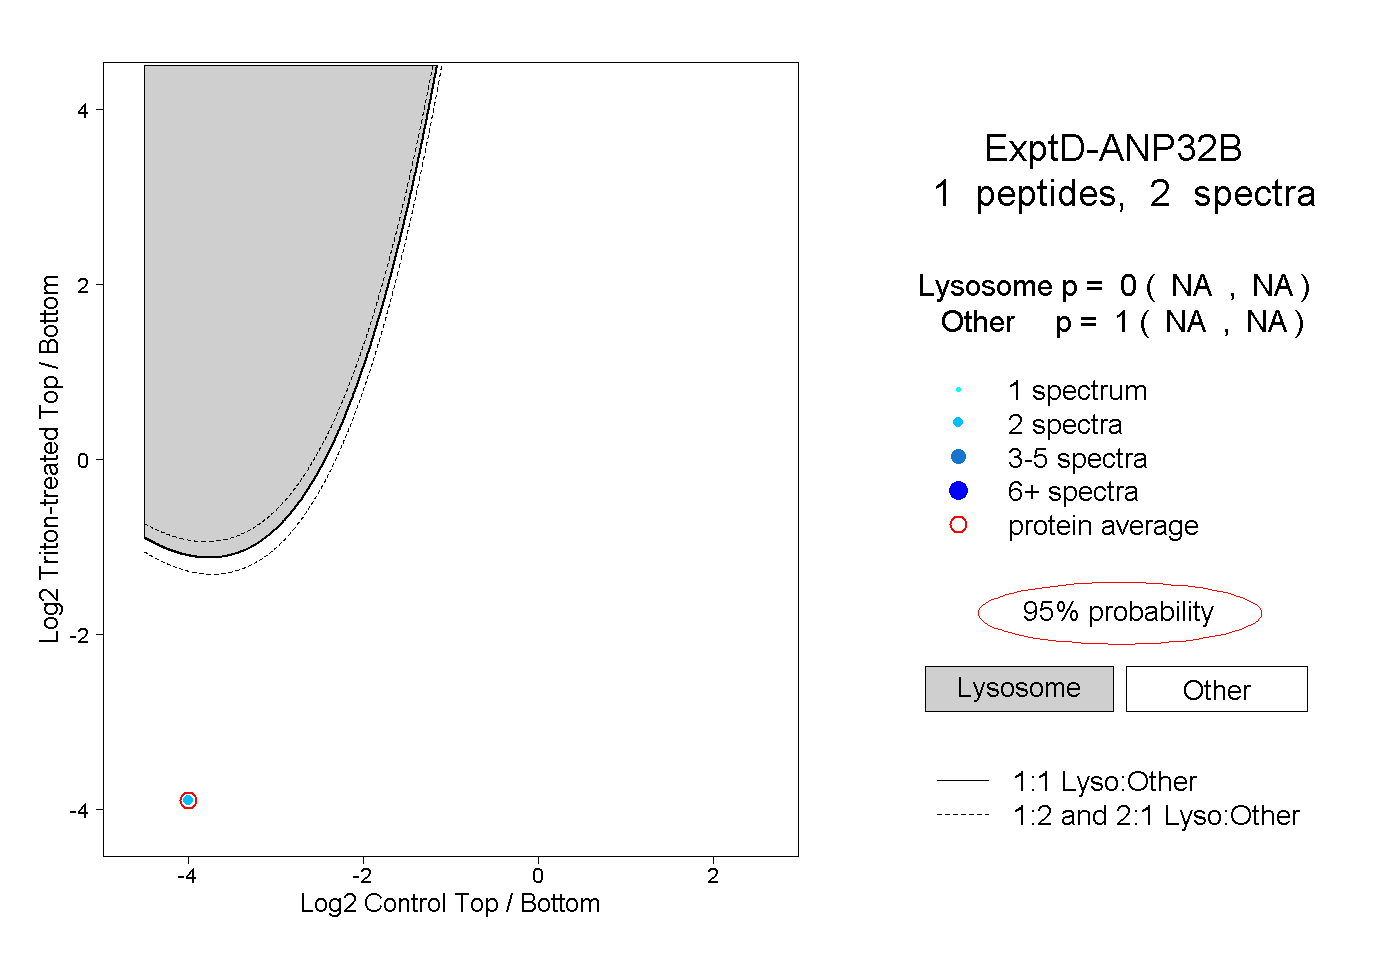
NA | NA
NA | NA