 3
3peptides
spectra
0.000 | 0.000
0.000 | 0.000
0.315 | 0.357
0.000 | 0.000
0.000 | 0.000
0.000 | 0.000
0.483 | 0.532
0.134 | 0.170
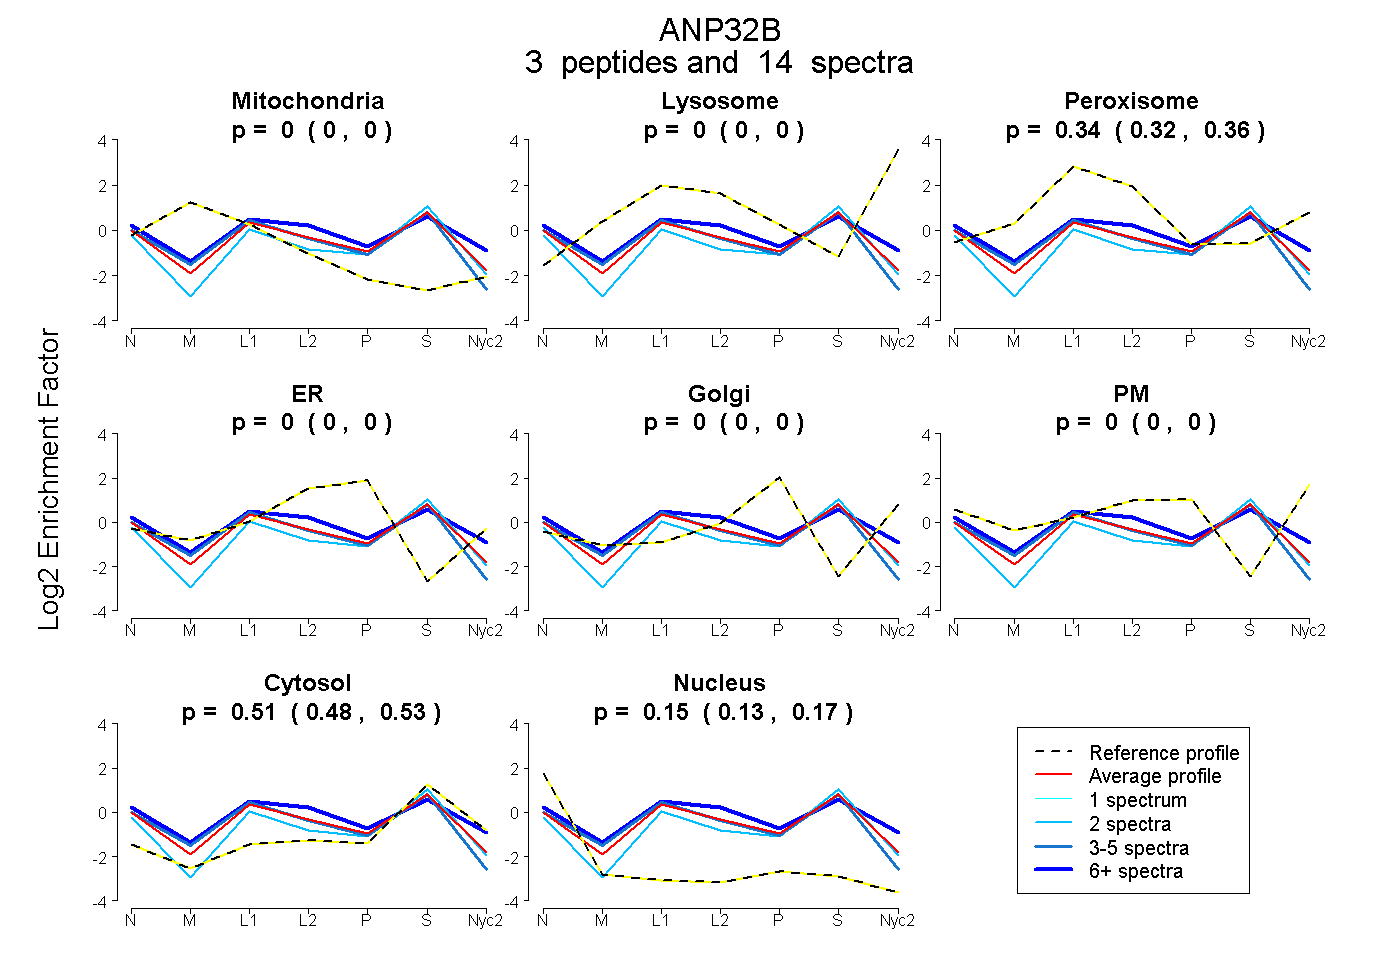
| Plot | Mito | Lyso | Perox | ER | Golgi | PM | Cytosol | Nucleus | |||||
| Expt A |
3 peptides |
14 spectra |
|
0.000 0.000 | 0.000 |
0.000 0.000 | 0.000 |
0.337 0.315 | 0.357 |
0.000 0.000 | 0.000 |
0.000 0.000 | 0.000 |
0.000 0.000 | 0.000 |
0.510 0.483 | 0.532 |
0.153 0.134 | 0.170 |
| 7 spectra, IFGGLDR | 0.000 | 0.000 | 0.461 | 0.005 | 0.000 | 0.000 | 0.415 | 0.118 | ||
| 2 spectra, LLPQLSYLDGYDR | 0.000 | 0.000 | 0.178 | 0.000 | 0.000 | 0.000 | 0.691 | 0.131 | ||
| 5 spectra, SLDLFGCEVTNR | 0.007 | 0.000 | 0.340 | 0.000 | 0.000 | 0.000 | 0.451 | 0.201 |
| Plot | Mito | Lyso or Perox | ER | Golgi | PM | Cytosol | Nucleus | ||||||
| Expt B |
2 peptides |
7 spectra |
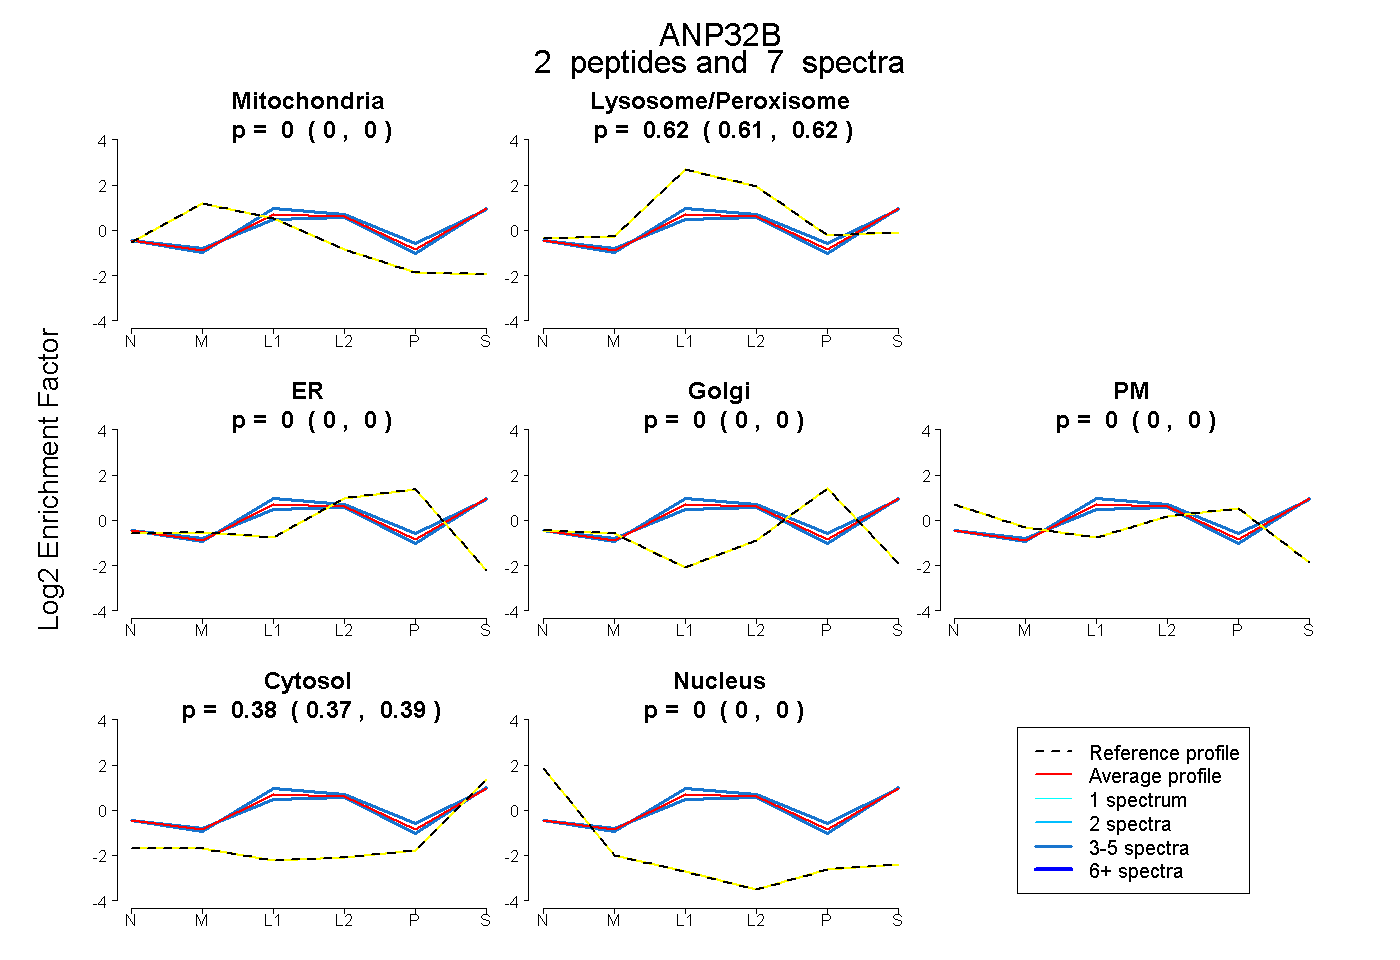 |
0.000 0.000 | 0.000 |
0.616 0.606 | 0.625 |
0.000 0.000 | 0.000 |
0.000 0.000 | 0.000 |
0.000 0.000 | 0.000 |
0.384 0.374 | 0.393 |
0.000 0.000 | 0.000 |
|||
| Plot | Lyso | Other | |||||||||||
| Expt C |
4 peptides |
18 spectra |
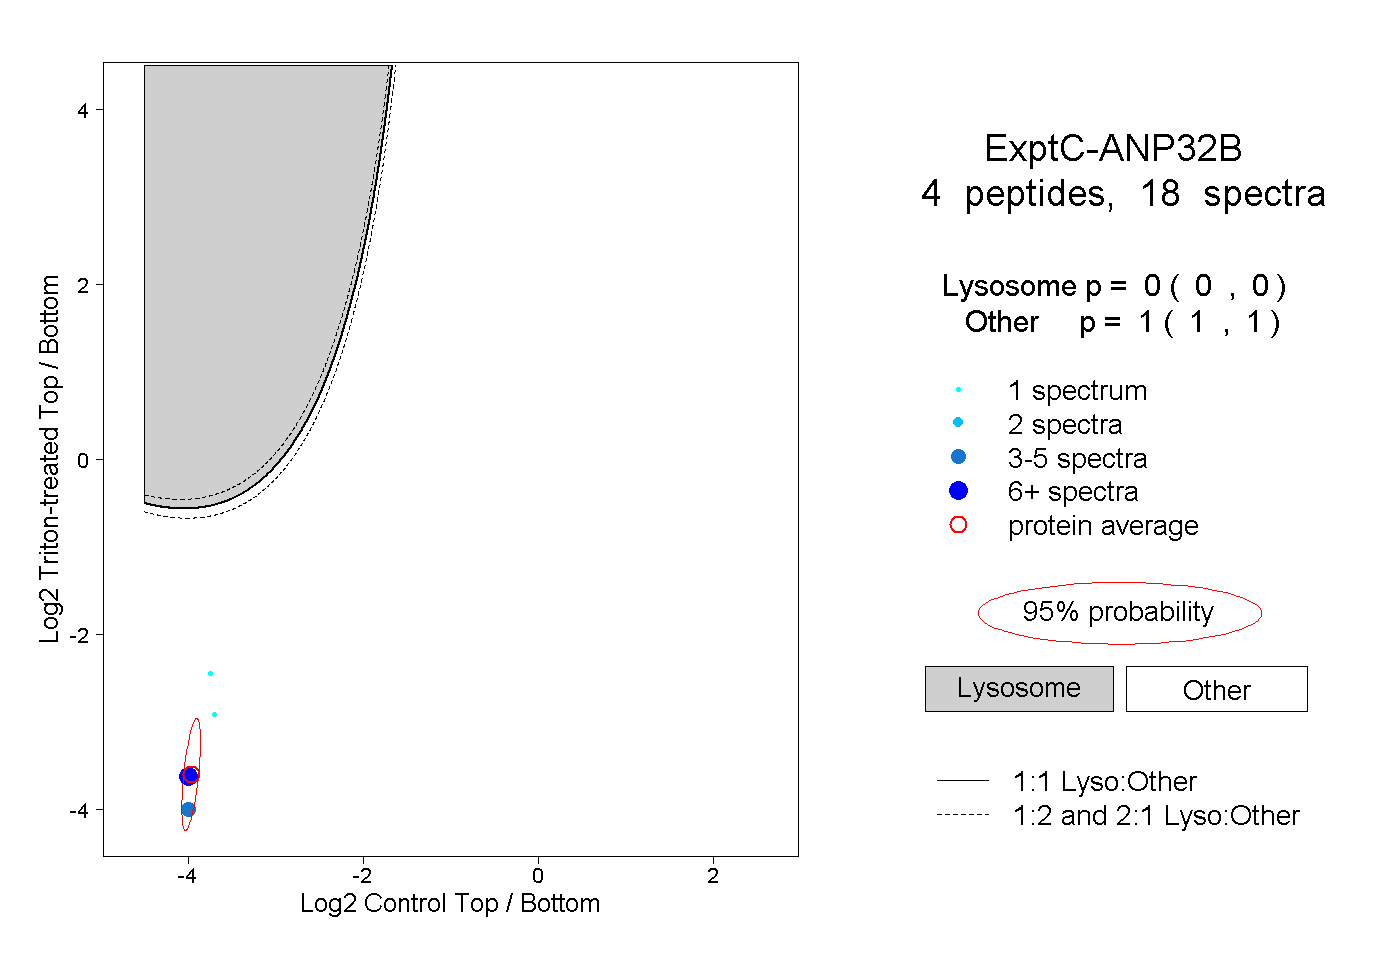 |
0.000 0.000 | 0.000 |
1.000 1.000 | 1.000 |
||||||||
| Plot | Lyso | Other | |||||||||||
| Expt D |
1 peptide |
2 spectra |
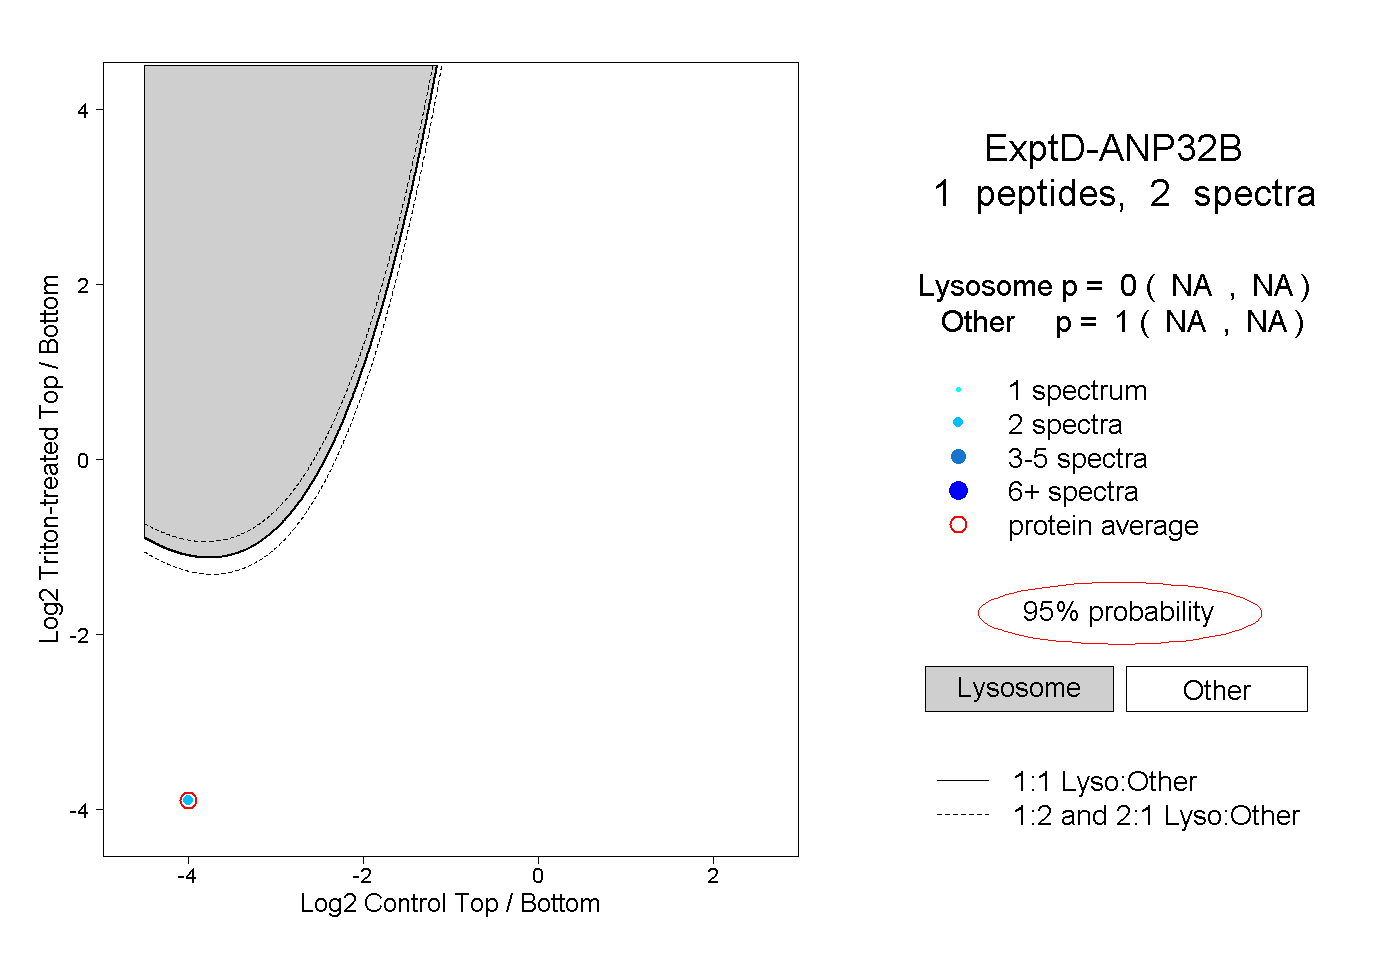 |
0.000 NA | NA |
1.000 NA | NA |