 11
11peptides
spectra
0.000 | 0.000
1.000 | 1.000
0.000 | 0.000
0.000 | 0.000
0.000 | 0.000
0.000 | 0.000
0.000 | 0.000
0.000 | 0.000
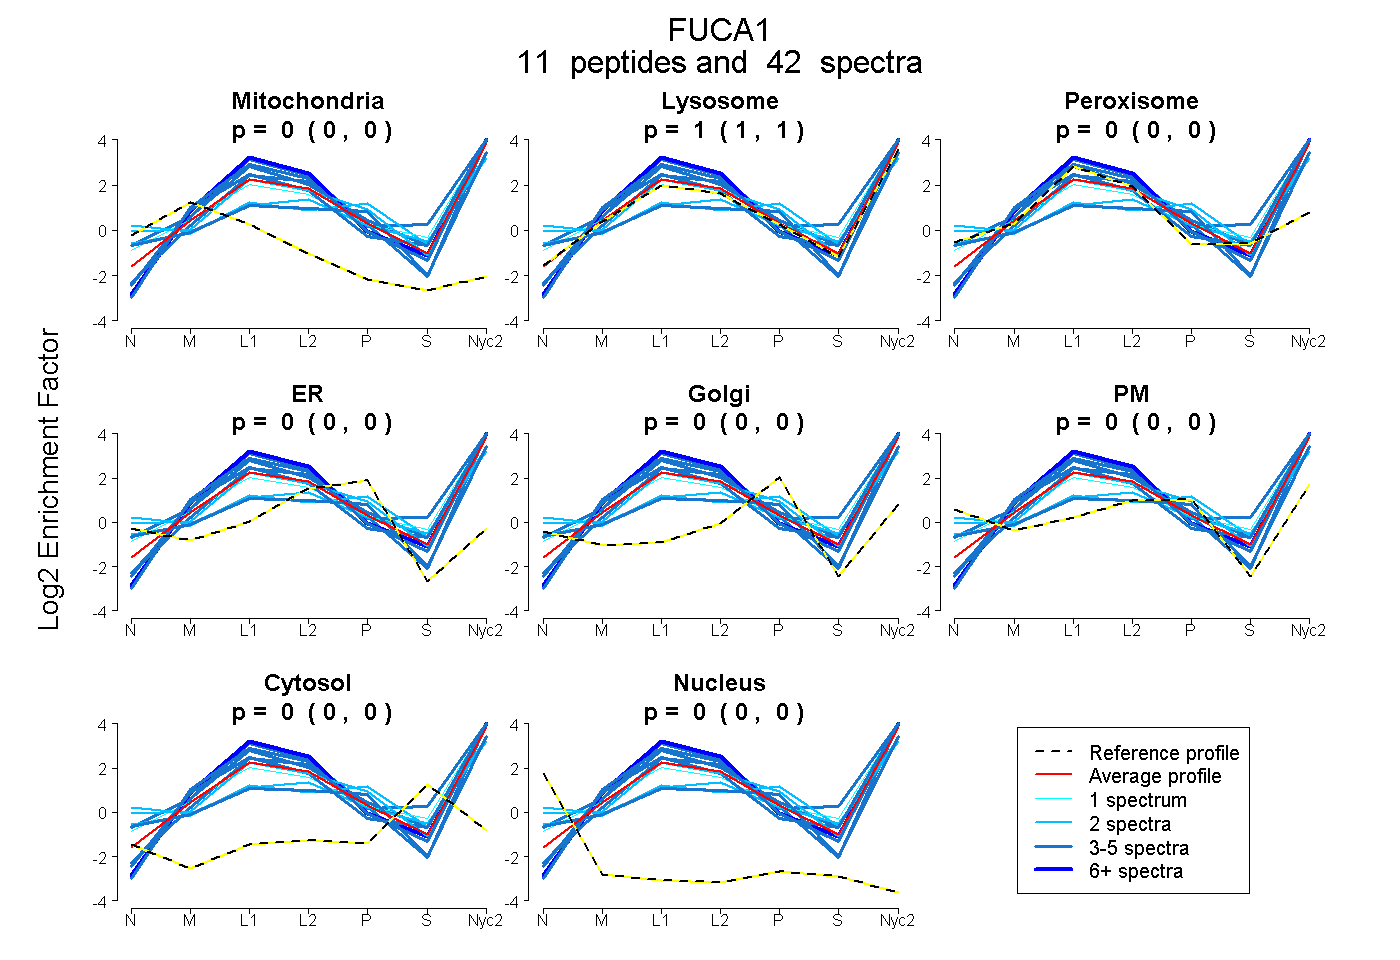
| Plot | Mito | Lyso | Perox | ER | Golgi | PM | Cytosol | Nucleus | |||||
| Expt A |
11 peptides |
42 spectra |
|
0.000 0.000 | 0.000 |
1.000 1.000 | 1.000 |
0.000 0.000 | 0.000 |
0.000 0.000 | 0.000 |
0.000 0.000 | 0.000 |
0.000 0.000 | 0.000 |
0.000 0.000 | 0.000 |
0.000 0.000 | 0.000 |
| 5 spectra, DGVIVPIFQER | 0.000 | 0.969 | 0.031 | 0.000 | 0.000 | 0.000 | 0.000 | 0.000 | ||
| 5 spectra, ASWGYR | 0.000 | 1.000 | 0.000 | 0.000 | 0.000 | 0.000 | 0.000 | 0.000 | ||
| 1 spectrum, LLAVGK | 0.000 | 1.000 | 0.000 | 0.000 | 0.000 | 0.000 | 0.000 | 0.000 | ||
| 2 spectra, HGGYYNCEDK | 0.000 | 0.710 | 0.000 | 0.000 | 0.161 | 0.101 | 0.028 | 0.000 | ||
| 4 spectra, DQVVVNDR | 0.000 | 1.000 | 0.000 | 0.000 | 0.000 | 0.000 | 0.000 | 0.000 | ||
| 2 spectra, TQHFVSTK | 0.000 | 0.831 | 0.000 | 0.000 | 0.000 | 0.169 | 0.000 | 0.000 | ||
| 4 spectra, TMPELYDLVNR | 0.000 | 1.000 | 0.000 | 0.000 | 0.000 | 0.000 | 0.000 | 0.000 | ||
| 2 spectra, DVGPHR | 0.000 | 0.588 | 0.034 | 0.000 | 0.000 | 0.313 | 0.065 | 0.000 | ||
| 8 spectra, DLVGELGAAVR | 0.000 | 1.000 | 0.000 | 0.000 | 0.000 | 0.000 | 0.000 | 0.000 | ||
| 4 spectra, WEMCTSVDK | 0.000 | 0.597 | 0.000 | 0.000 | 0.067 | 0.336 | 0.000 | 0.000 | ||
| 5 spectra, WFDEAK | 0.000 | 1.000 | 0.000 | 0.000 | 0.000 | 0.000 | 0.000 | 0.000 |
| Plot | Mito | Lyso or Perox | ER | Golgi | PM | Cytosol | Nucleus | ||||||
| Expt B |
10 peptides |
17 spectra |
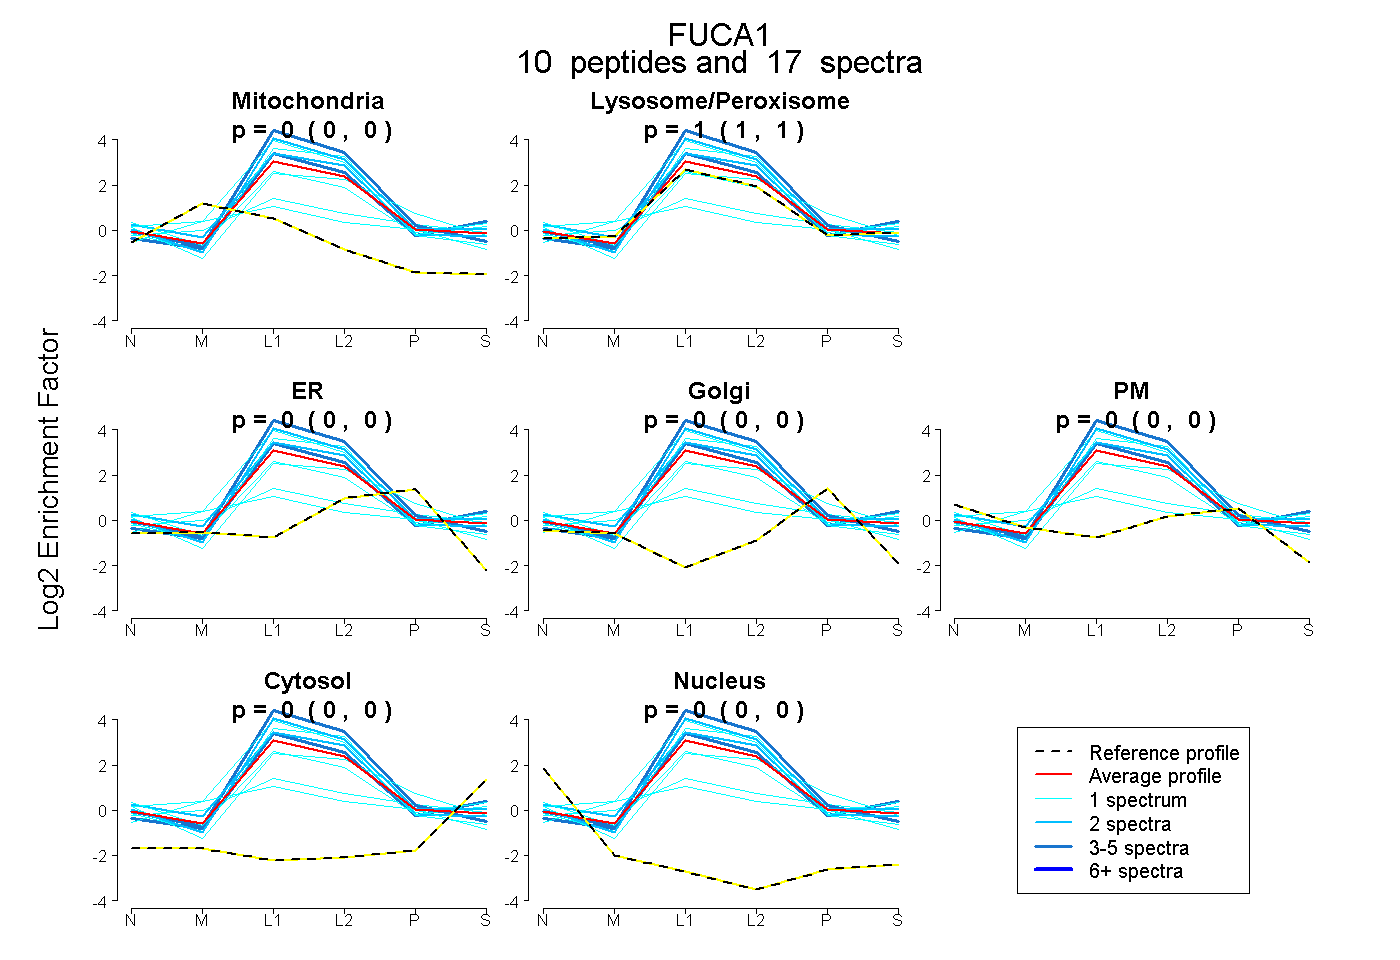 |
0.000 0.000 | 0.000 |
1.000 1.000 | 1.000 |
0.000 0.000 | 0.000 |
0.000 0.000 | 0.000 |
0.000 0.000 | 0.000 |
0.000 0.000 | 0.000 |
0.000 0.000 | 0.000 |
|||
| Plot | Lyso | Other | |||||||||||
| Expt C |
17 peptides |
213 spectra |
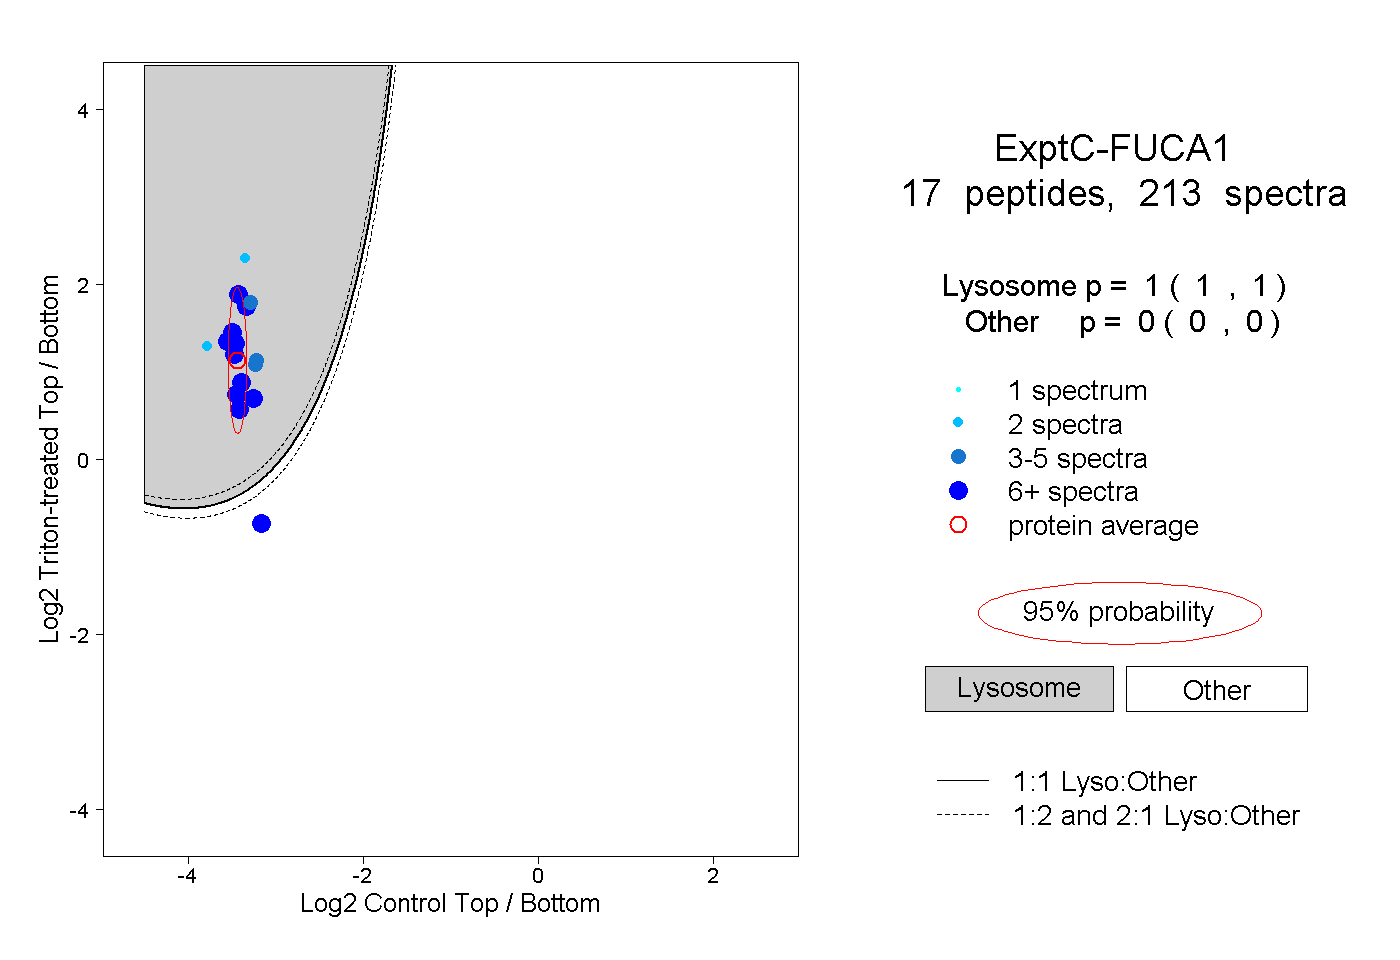 |
1.000 1.000 | 1.000 |
0.000 0.000 | 0.000 |
||||||||
| Plot | Lyso | Other | |||||||||||
| Expt D |
7 peptides |
13 spectra |
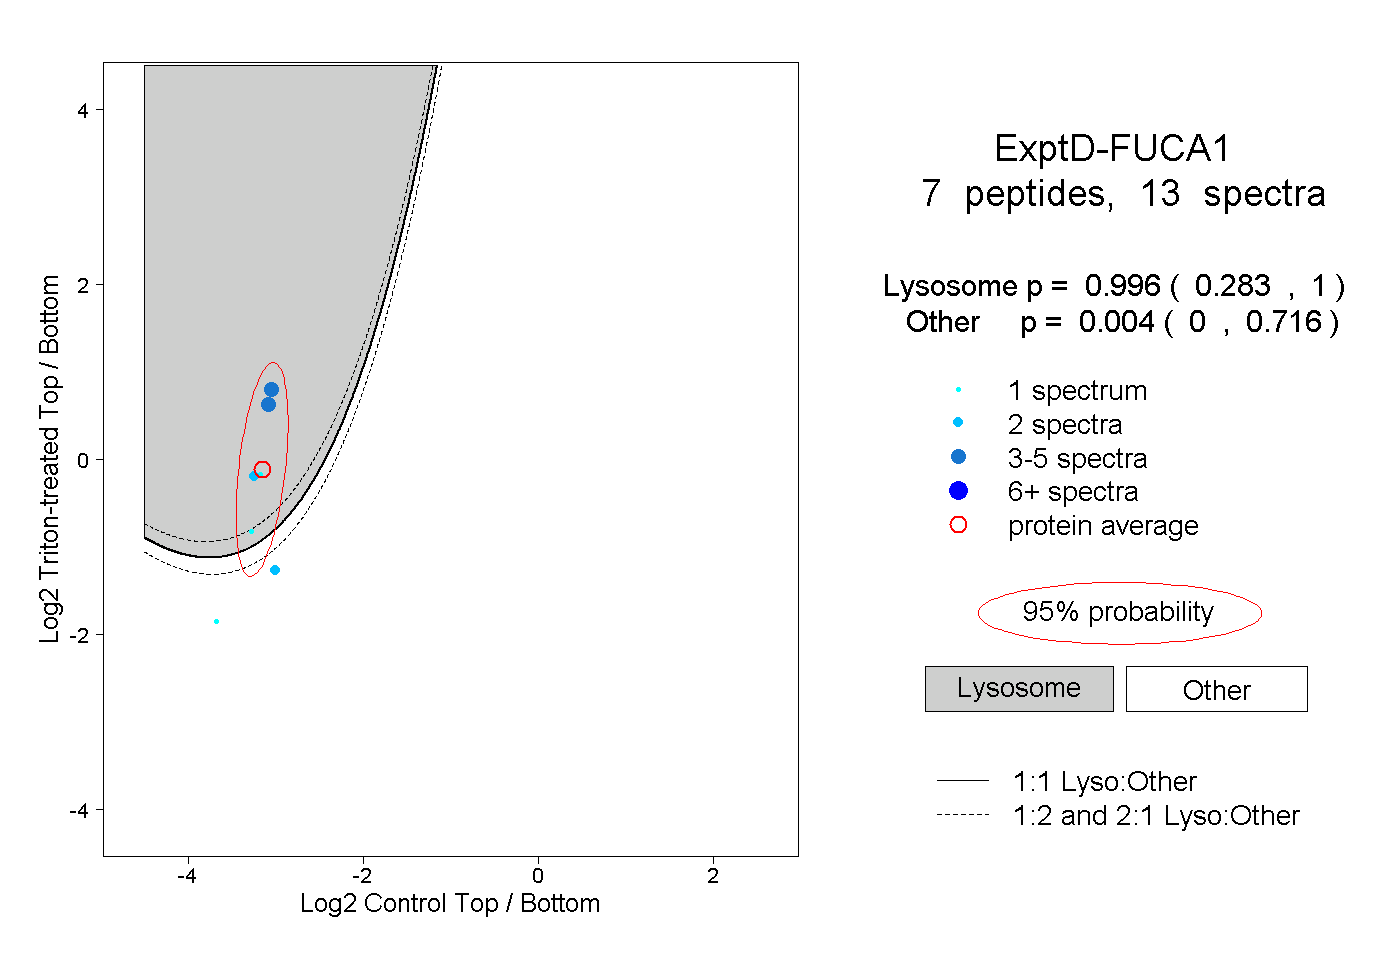 |
0.996 0.283 | 1.000 |
0.004 0.000 | 0.716 |