 7
7peptides
spectra
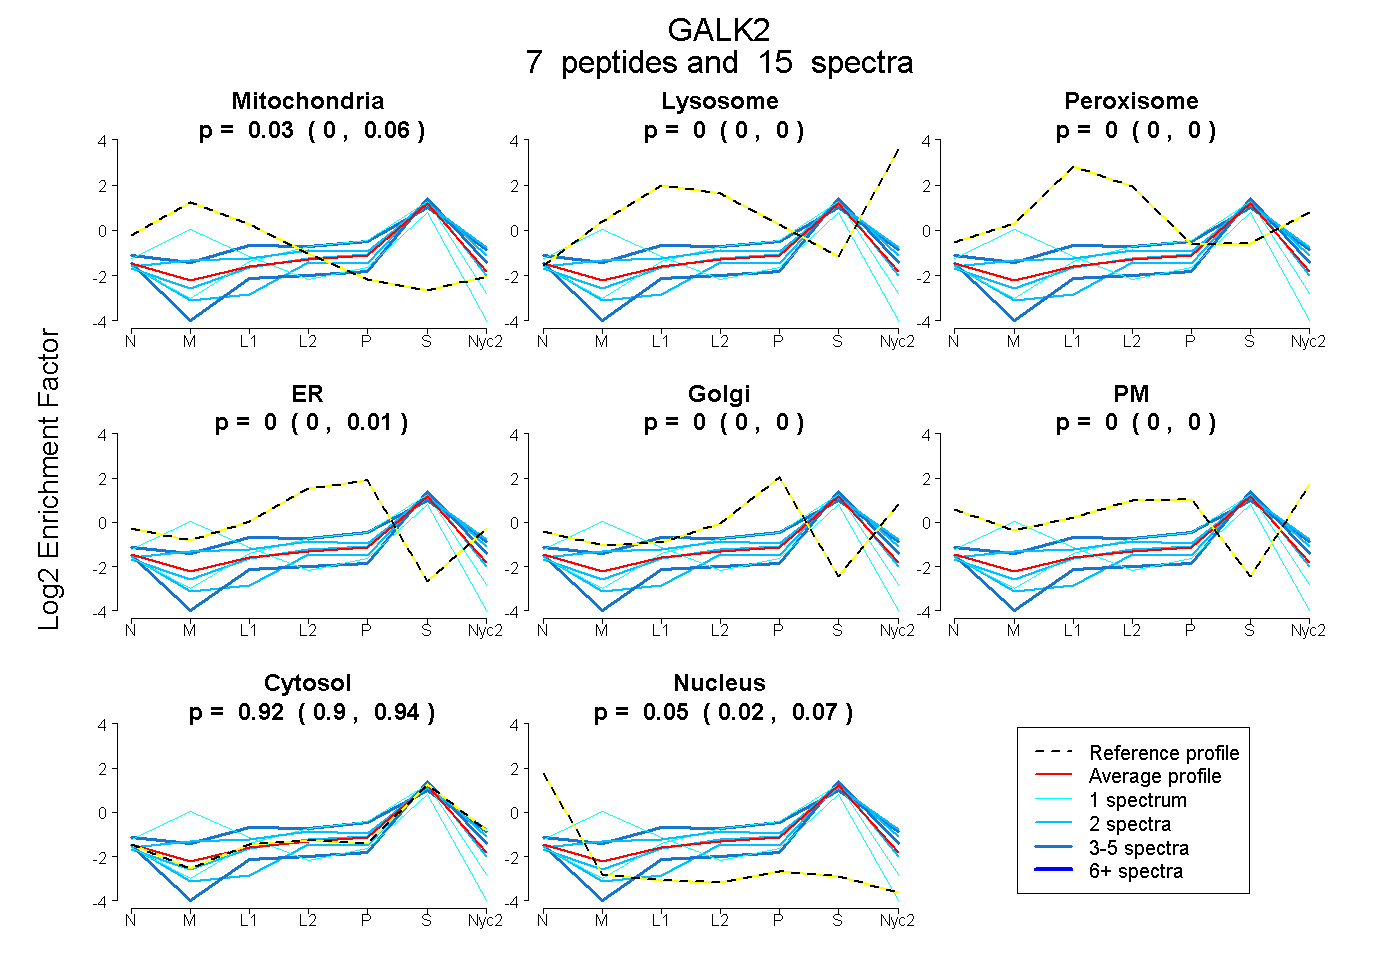
0.000 | 0.064
0.000 | 0.000
0.000 | 0.000
0.000 | 0.010
0.000 | 0.000
0.000 | 0.000
0.895 | 0.935
0.022 | 0.072
| Plot | Mito | Lyso | Perox | ER | Golgi | PM | Cytosol | Nucleus | |||||
| Expt A |
7 peptides |
15 spectra |
|
0.032 0.000 | 0.064 |
0.000 0.000 | 0.000 |
0.000 0.000 | 0.000 |
0.000 0.000 | 0.010 |
0.000 0.000 | 0.000 |
0.000 0.000 | 0.000 |
0.918 0.895 | 0.935 |
0.050 0.022 | 0.072 |
| 2 spectra, VQVAEHPR | 0.080 | 0.075 | 0.012 | 0.013 | 0.000 | 0.000 | 0.821 | 0.000 | ||
| 2 spectra, CLGISLEELR | 0.000 | 0.000 | 0.000 | 0.000 | 0.000 | 0.000 | 0.877 | 0.123 | ||
| 3 spectra, AATSHFNVR | 0.021 | 0.000 | 0.134 | 0.097 | 0.010 | 0.000 | 0.738 | 0.000 | ||
| 1 spectrum, LPSGAVFVIANSCVEMNK | 0.391 | 0.000 | 0.000 | 0.000 | 0.000 | 0.000 | 0.508 | 0.101 | ||
| 1 spectrum, TQPLWHNYFLCGFK | 0.000 | 0.000 | 0.000 | 0.056 | 0.000 | 0.000 | 0.888 | 0.056 | ||
| 4 spectra, LIEFSPLR | 0.000 | 0.000 | 0.000 | 0.000 | 0.000 | 0.000 | 0.902 | 0.098 | ||
| 2 spectra, GLQWDK | 0.000 | 0.000 | 0.000 | 0.003 | 0.000 | 0.000 | 0.997 | 0.000 |
| Plot | Mito | Lyso or Perox | ER | Golgi | PM | Cytosol | Nucleus | ||||||
| Expt B |
2 peptides |
5 spectra |
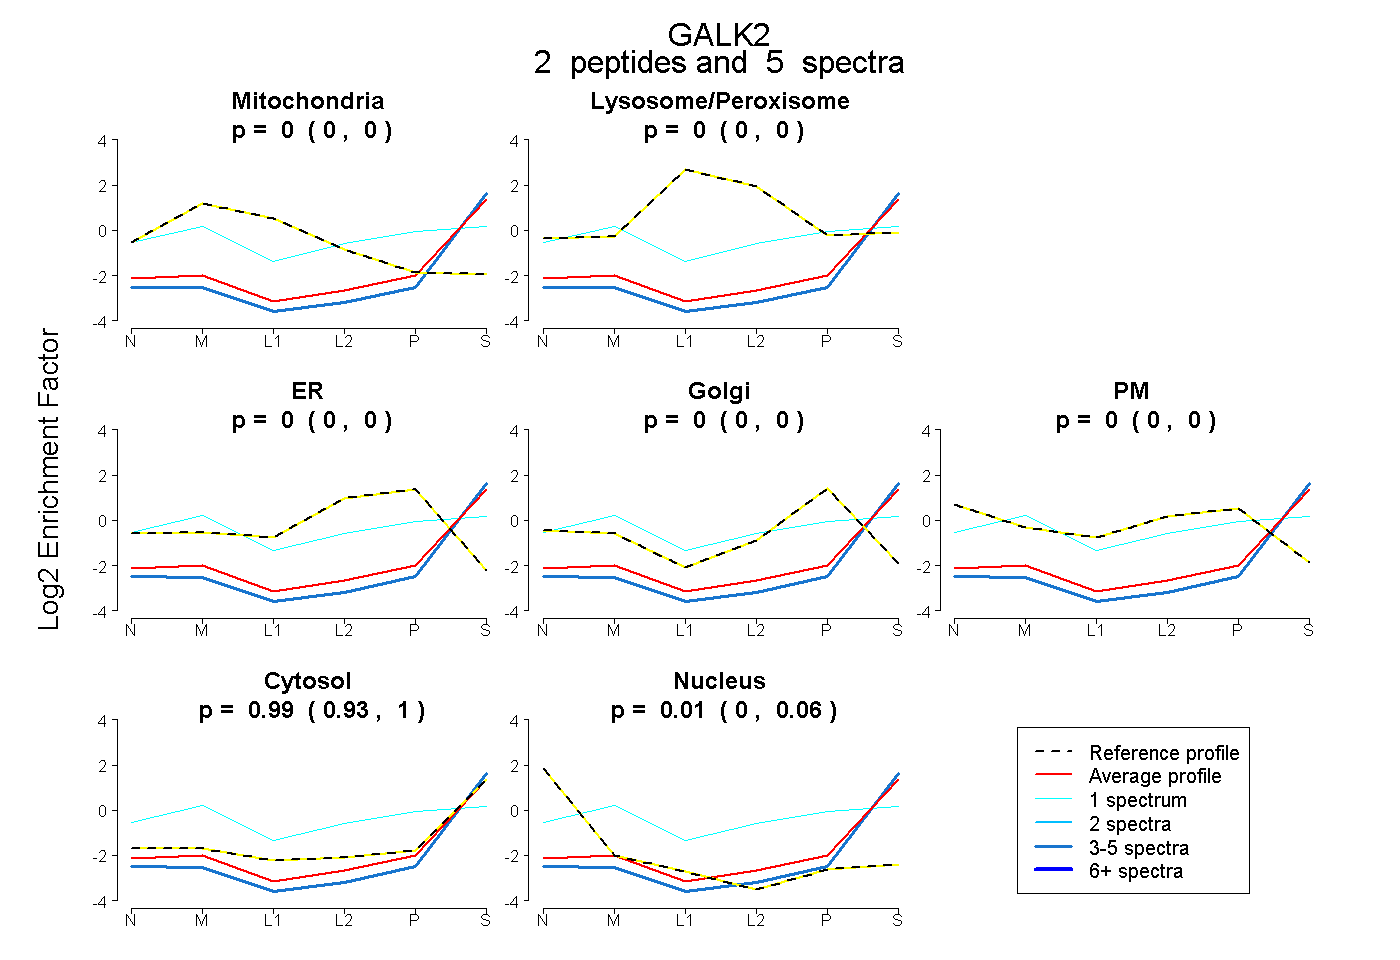 |
0.000 0.000 | 0.000 |
0.000 0.000 | 0.000 |
0.000 0.000 | 0.000 |
0.000 0.000 | 0.000 |
0.000 0.000 | 0.000 |
0.993 0.931 | 1.000 |
0.007 0.000 | 0.058 |
|||
| Plot | Lyso | Other | |||||||||||
| Expt C |
6 peptides |
12 spectra |
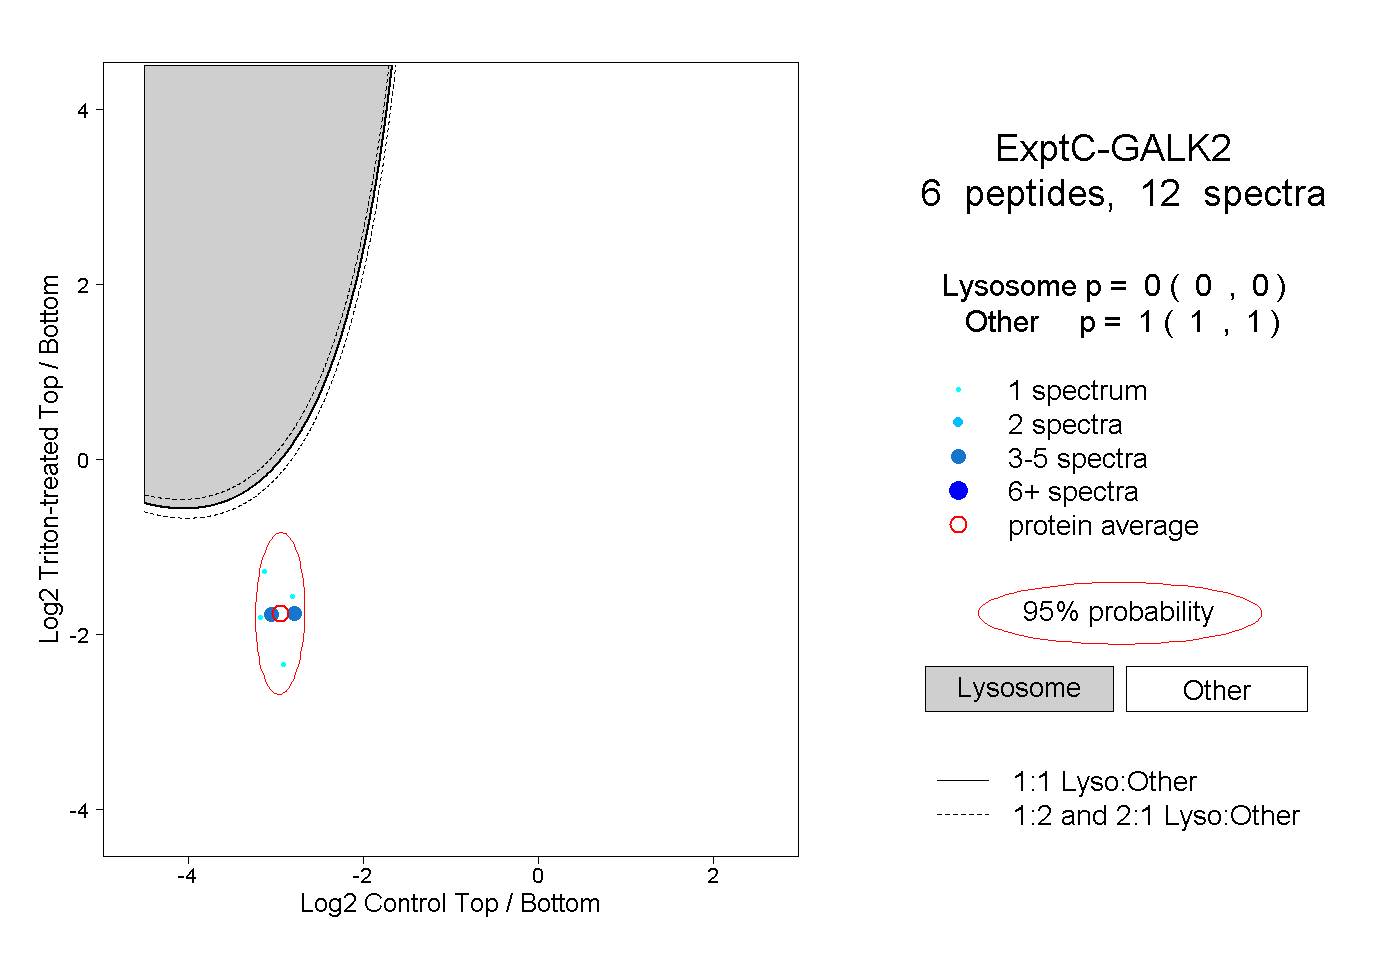 |
0.000 0.000 | 0.000 |
1.000 1.000 | 1.000 |