 2
2peptides
spectra
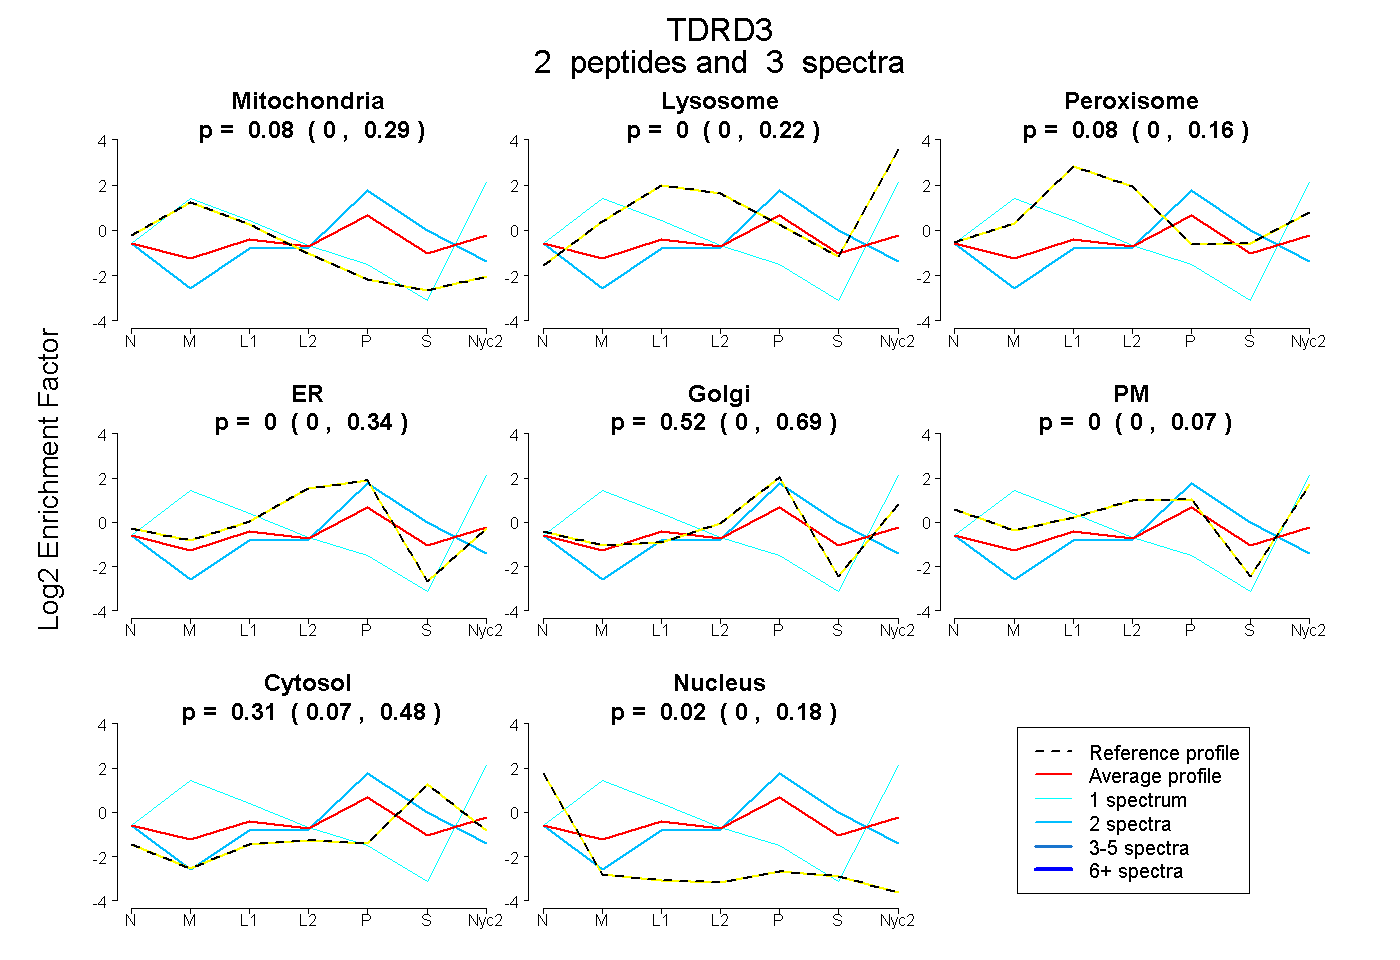
0.000 | 0.286
0.000 | 0.216
0.000 | 0.156
0.000 | 0.342
0.000 | 0.694
0.000 | 0.072
0.072 | 0.483
0.000 | 0.176
| Plot | Mito | Lyso | Perox | ER | Golgi | PM | Cytosol | Nucleus | |||||
| Expt A |
2 peptides |
3 spectra |
|
0.078 0.000 | 0.286 |
0.000 0.000 | 0.216 |
0.079 0.000 | 0.156 |
0.000 0.000 | 0.342 |
0.519 0.000 | 0.694 |
0.000 0.000 | 0.072 |
0.305 0.072 | 0.483 |
0.019 0.000 | 0.176 |