24
24peptides
spectra
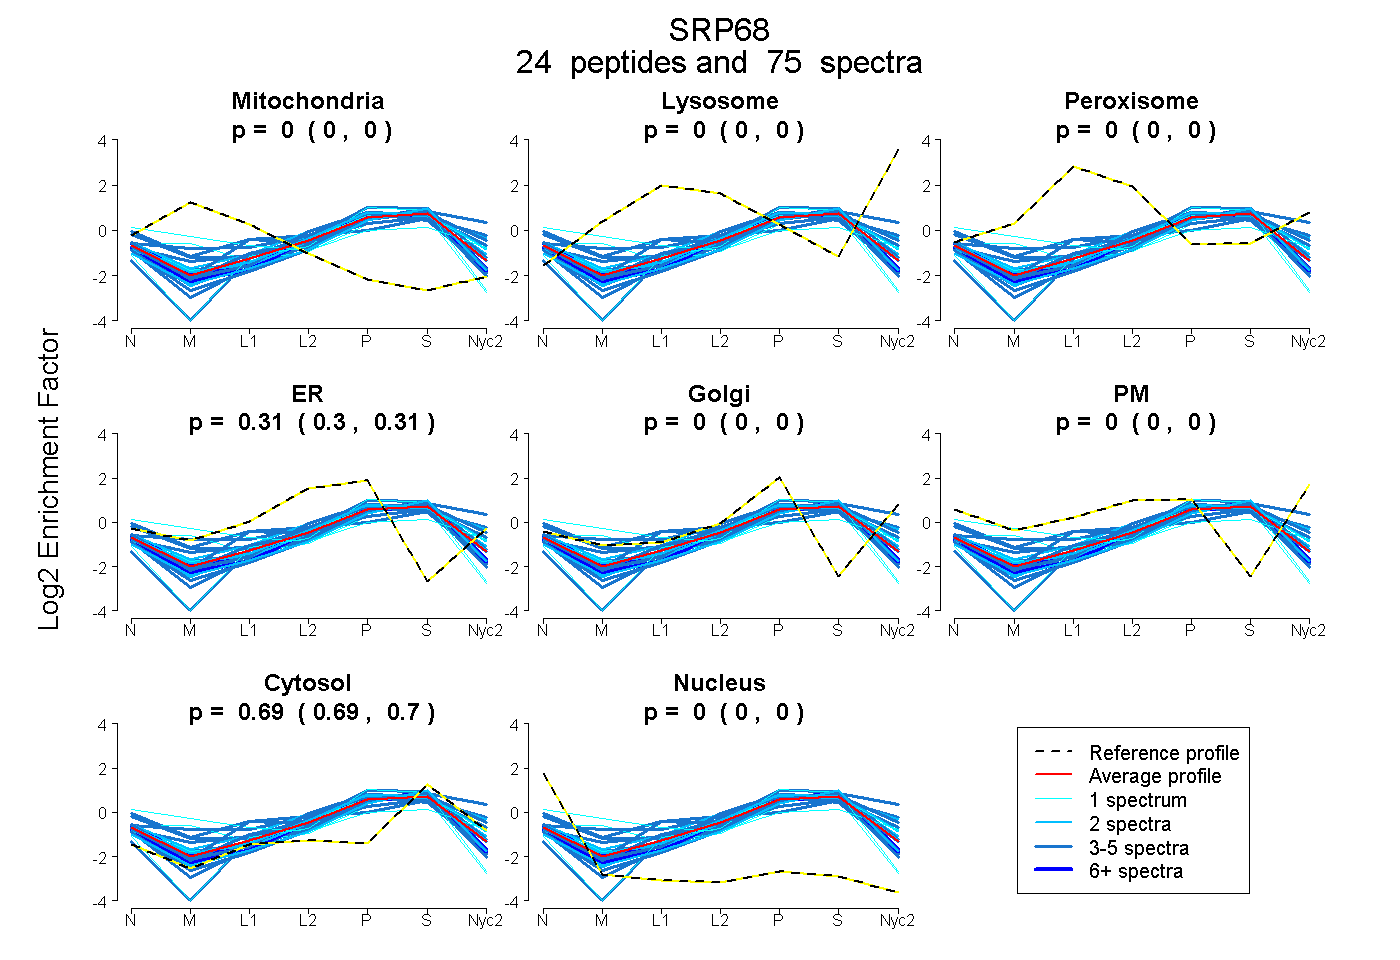
0.000 | 0.000
0.000 | 0.000
0.000 | 0.000
0.304 | 0.308
0.000 | 0.000
0.000 | 0.000
0.691 | 0.695
0.000 | 0.000
15peptides
spectra
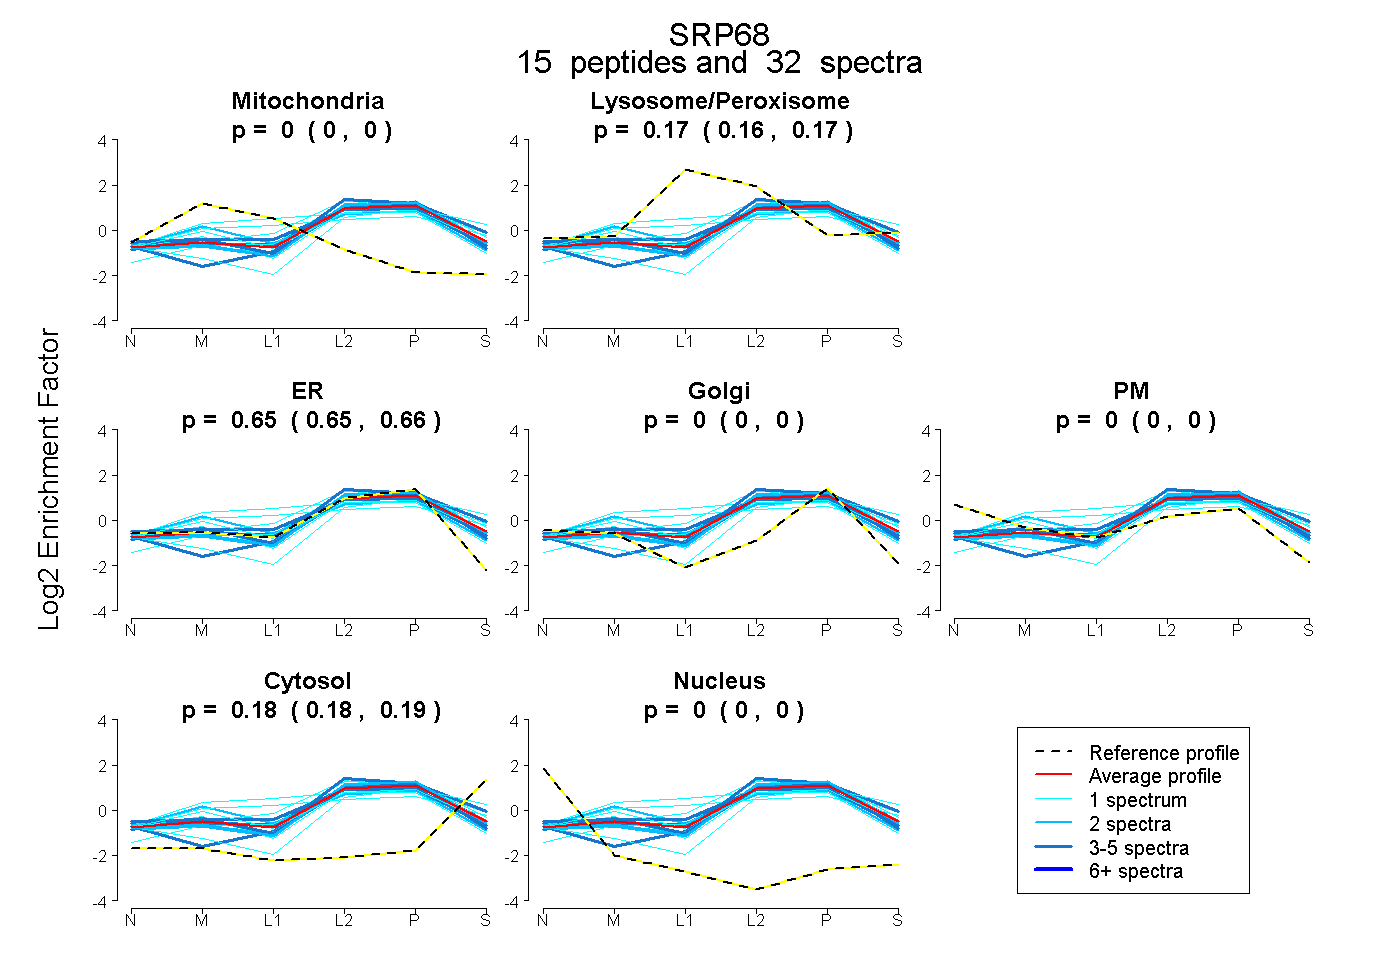
0.000 | 0.000
0.157 | 0.172
0.645 | 0.660
0.000 | 0.000
0.000 | 0.000
0.177 | 0.185
0.000 | 0.000
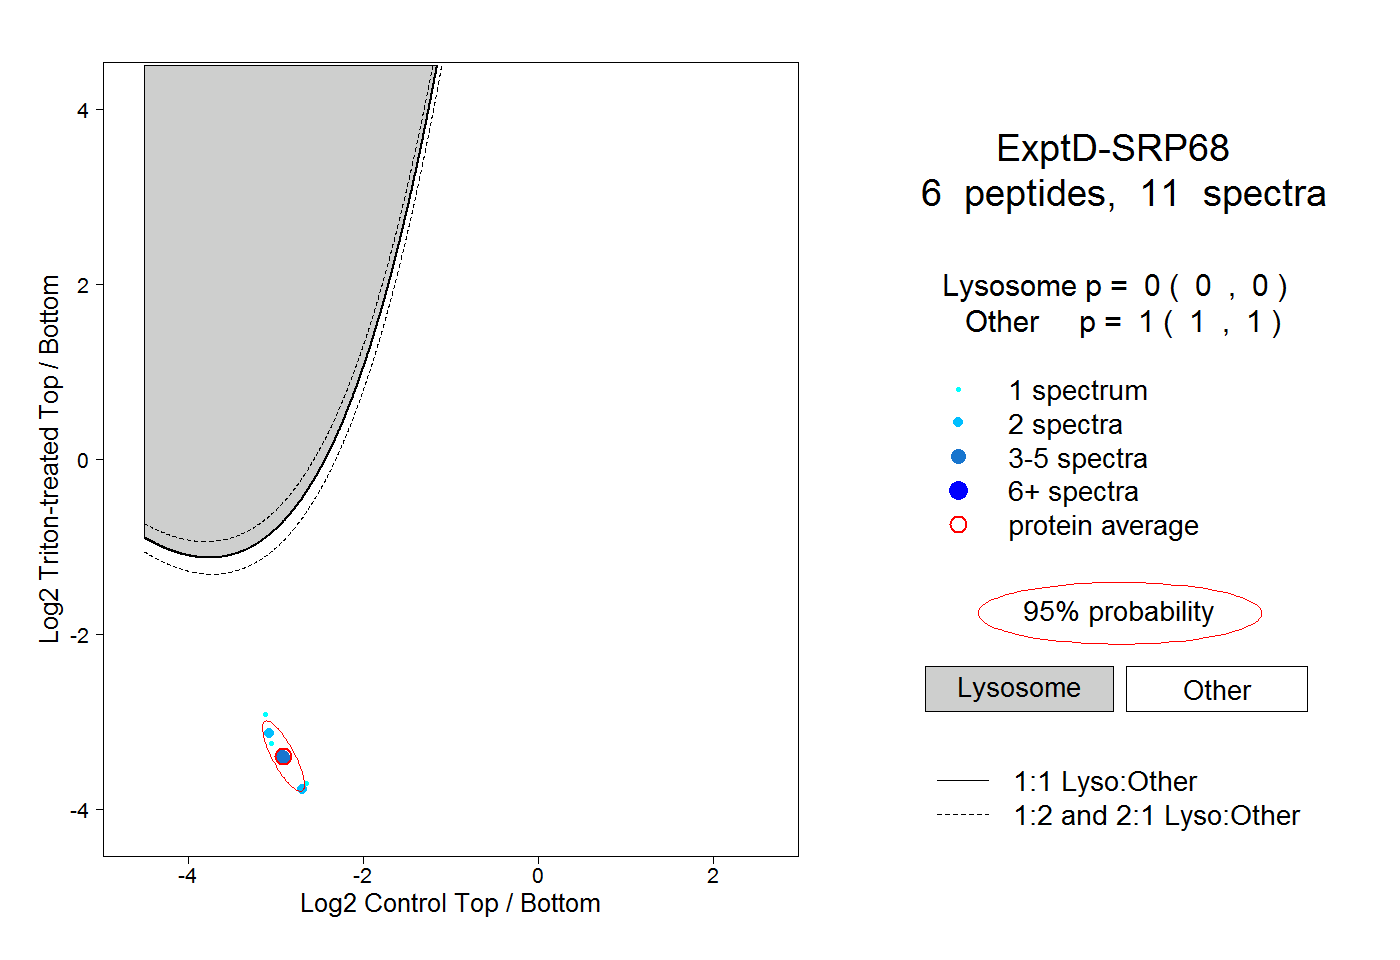
20peptides
spectra
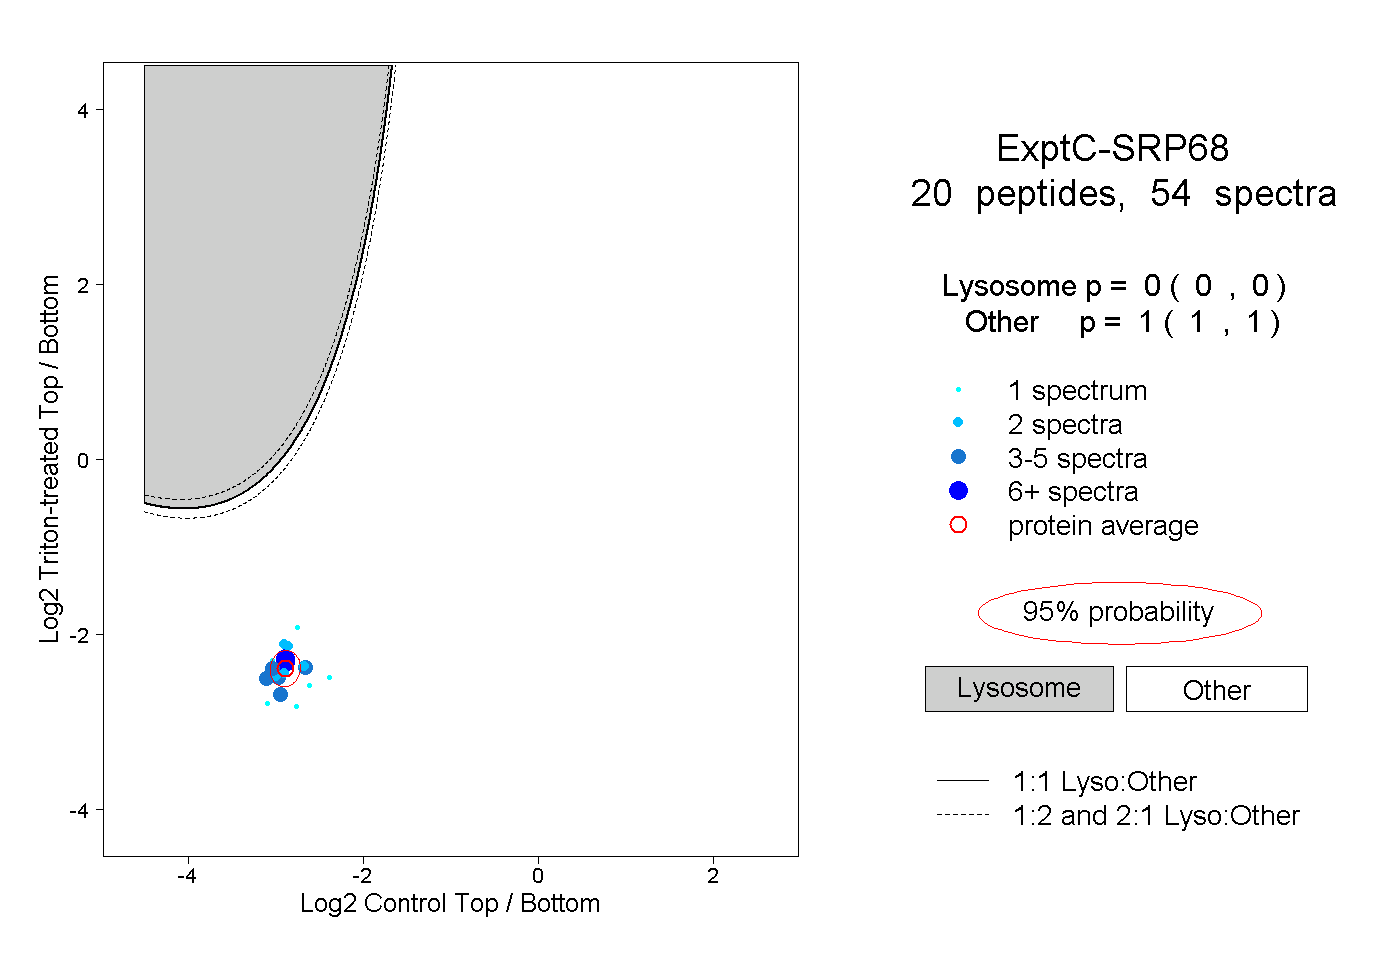
0.000 | 0.000
1.000 | 1.000