 1
1peptide
spectra
0.000 | 0.000
0.000 | 0.001
0.211 | 0.310
0.000 | 0.127
0.000 | 0.188
0.000 | 0.171
0.504 | 0.604
0.000 | 0.000
2peptides
spectra
NA | NA
NA | NA
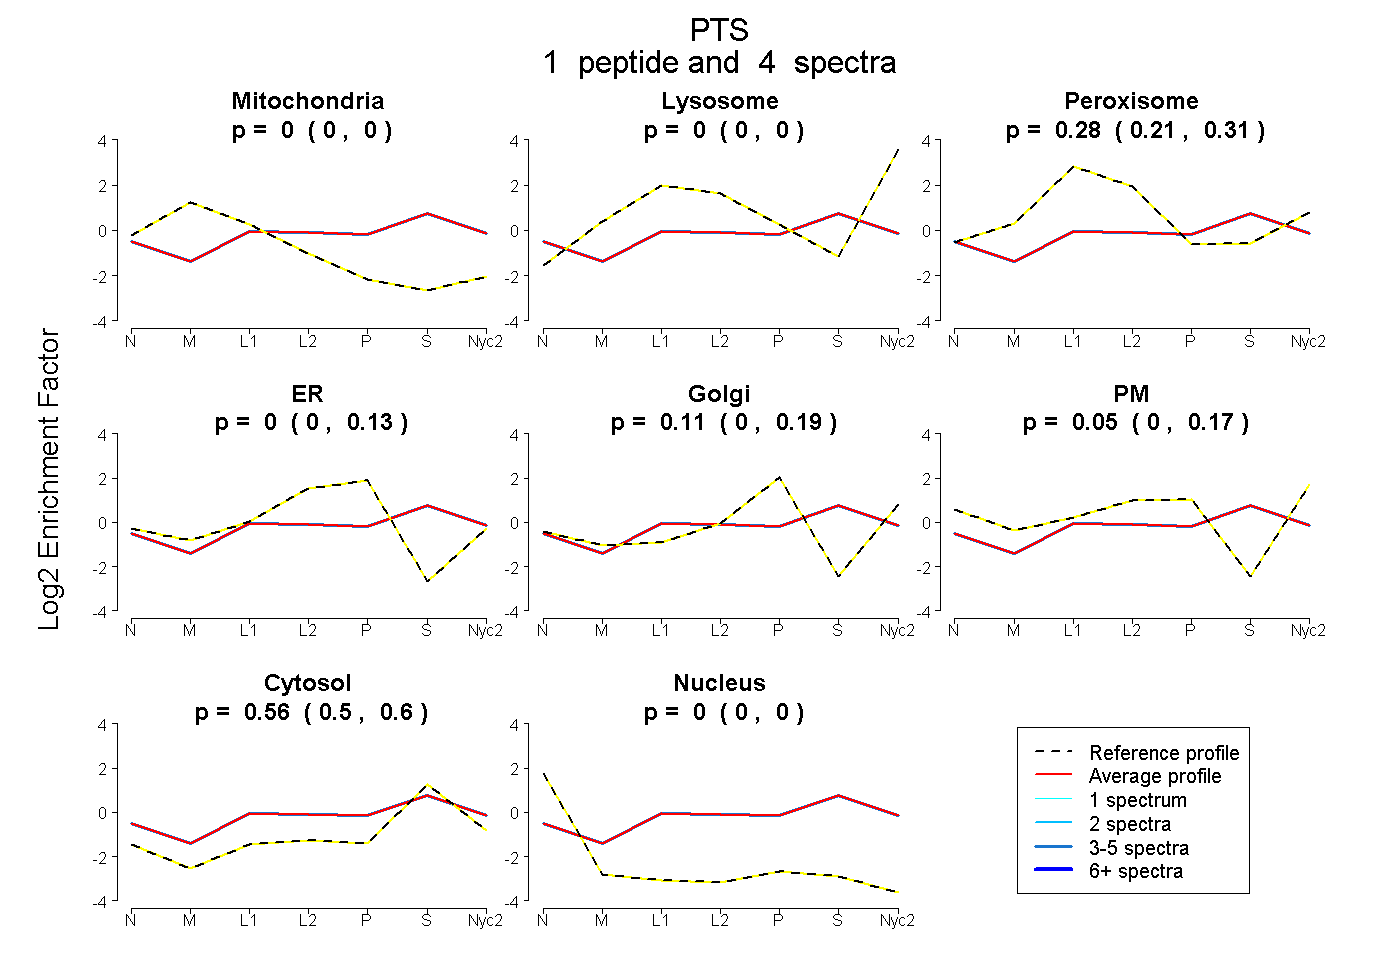
| Plot | Mito | Lyso | Perox | ER | Golgi | PM | Cytosol | Nucleus | |||||
| Expt A |
1 peptide |
4 spectra |
|
0.000 0.000 | 0.000 |
0.000 0.000 | 0.001 |
0.284 0.211 | 0.310 |
0.000 0.000 | 0.127 |
0.108 0.000 | 0.188 |
0.052 0.000 | 0.171 |
0.556 0.504 | 0.604 |
0.000 0.000 | 0.000 |
||
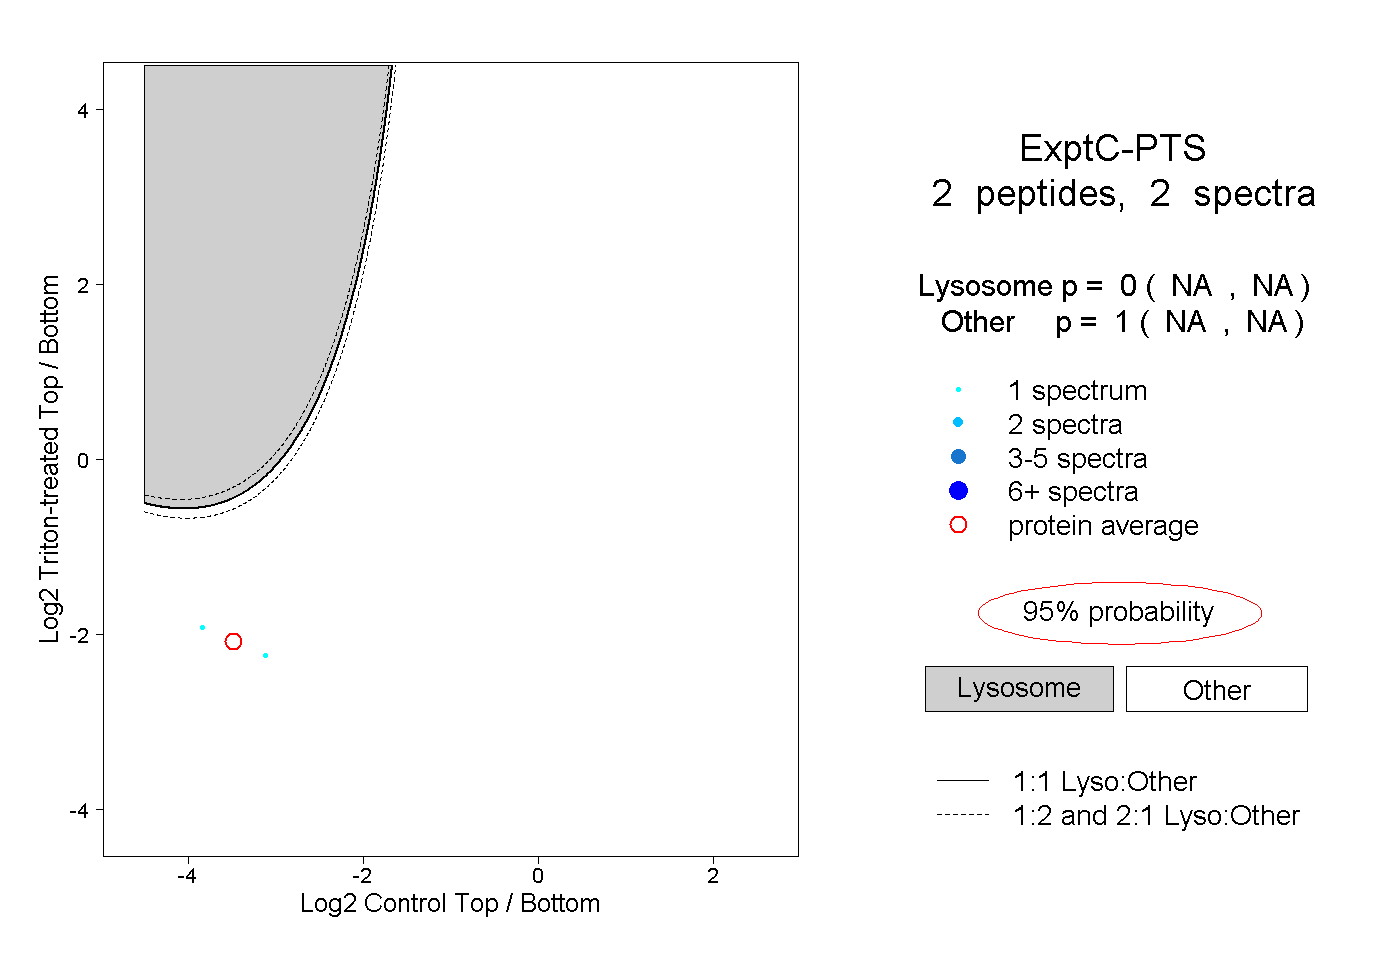
| Plot | Lyso | Other | |||||||||||
| Expt C |
2 peptides |
2 spectra |
|
0.000 NA | NA |
1.000 NA | NA |