8
8peptides
spectra
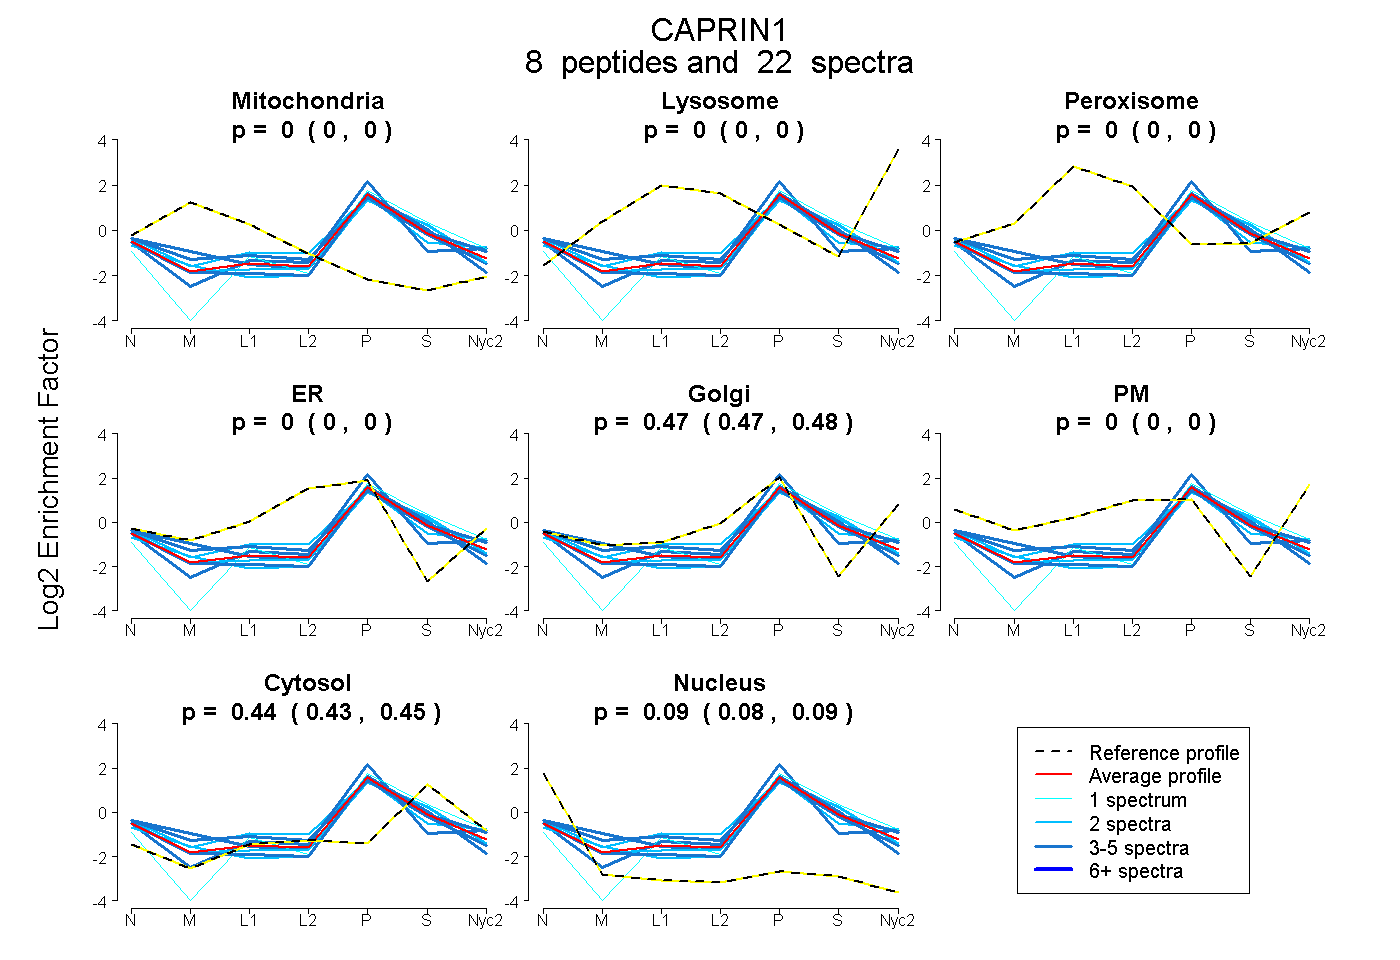
0.000 | 0.000
0.000 | 0.000
0.000 | 0.000
0.000 | 0.000
0.465 | 0.484
0.000 | 0.000
0.427 | 0.449
0.078 | 0.093
6peptides
spectra
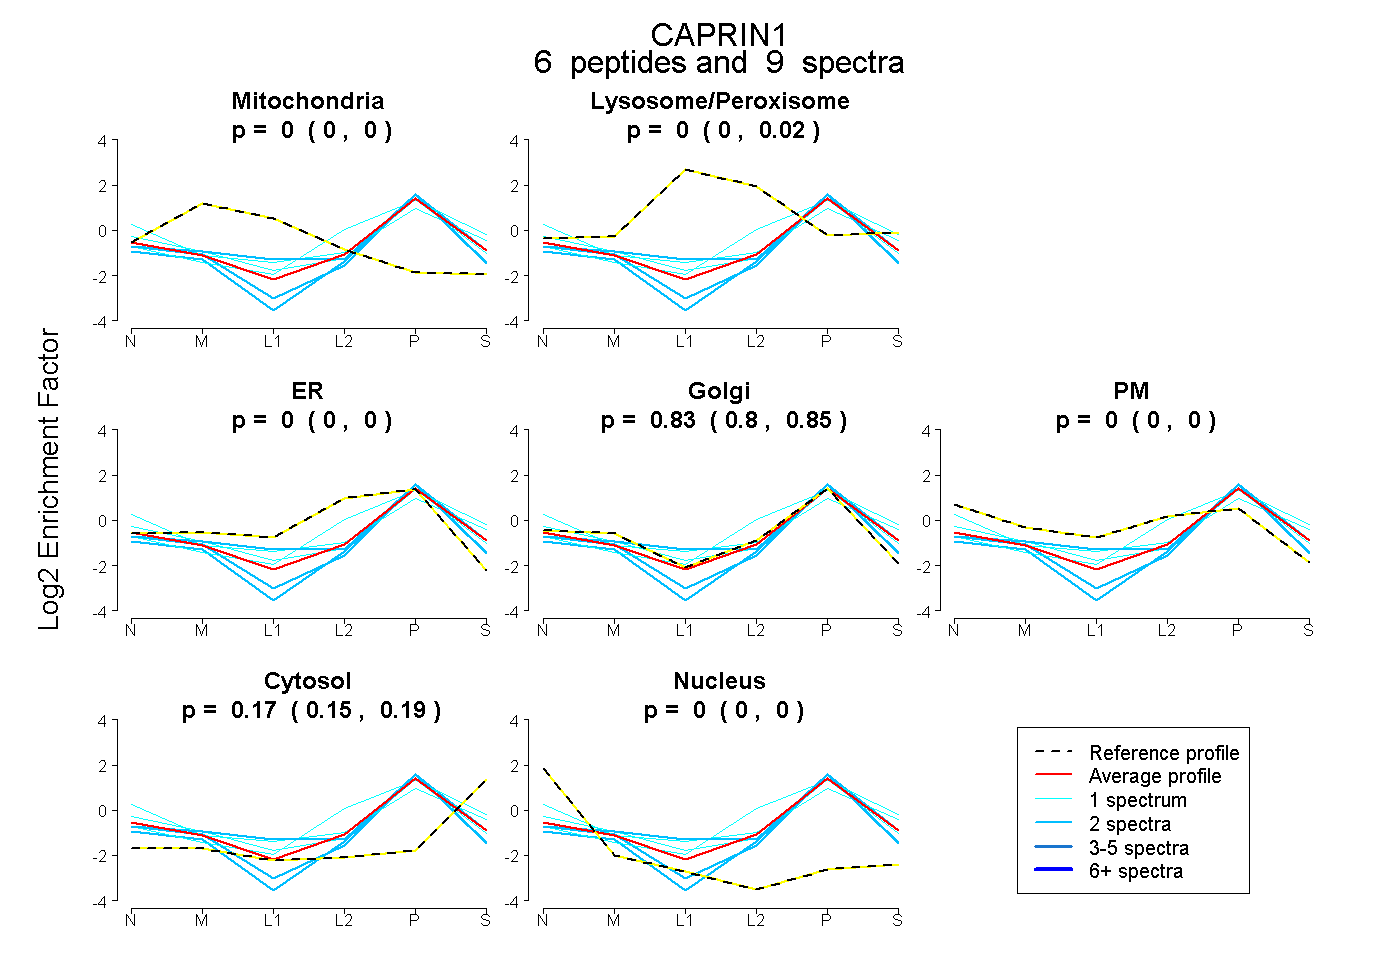
0.000 | 0.000
0.000 | 0.015
0.000 | 0.000
0.803 | 0.847
0.000 | 0.000
0.146 | 0.190
0.000 | 0.000
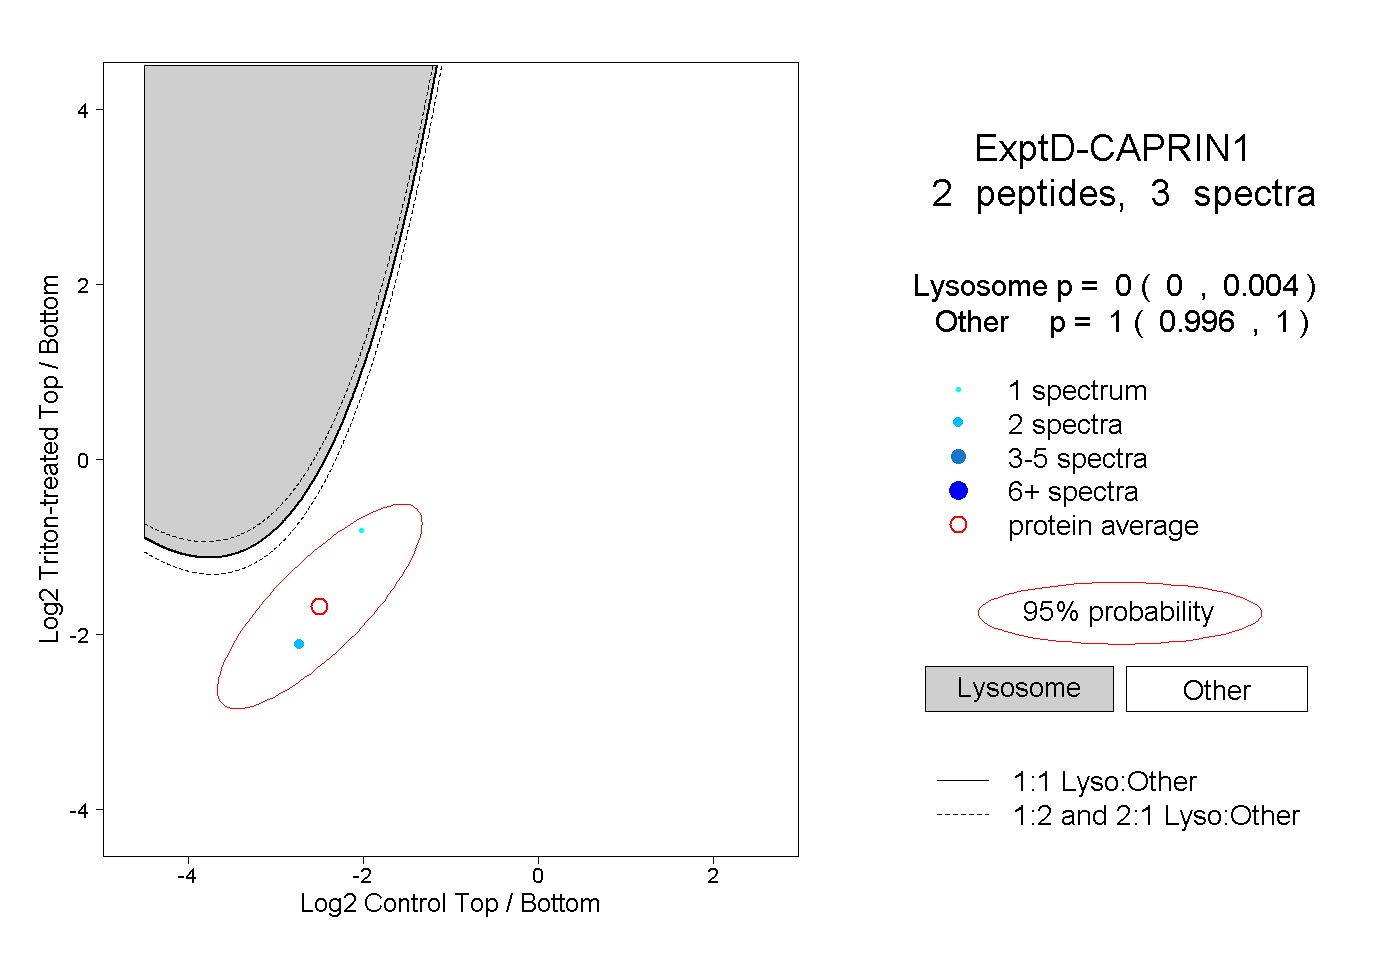
11peptides
spectra
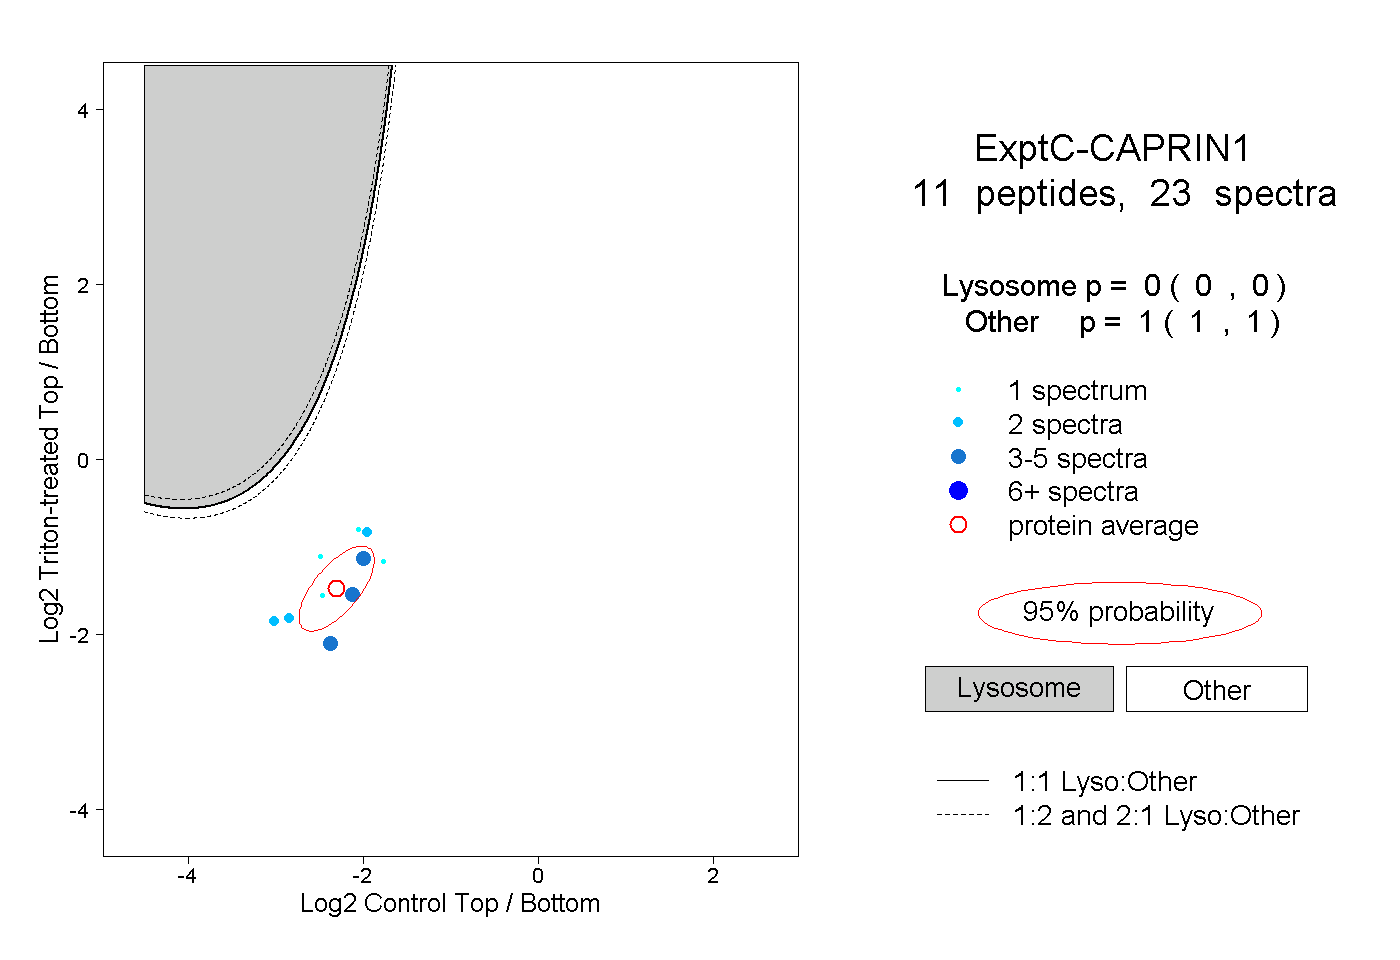
0.000 | 0.000
1.000 | 1.000