CAPRIN1
[ENSRNOP00000012428]
Main page
| | | Plot |
Mito |
Lyso |
|
Perox |
ER |
Golgi |
PM |
Cytosol |
Nucleus |
|
| Expt A |
 8
8
peptides |
22
spectra |
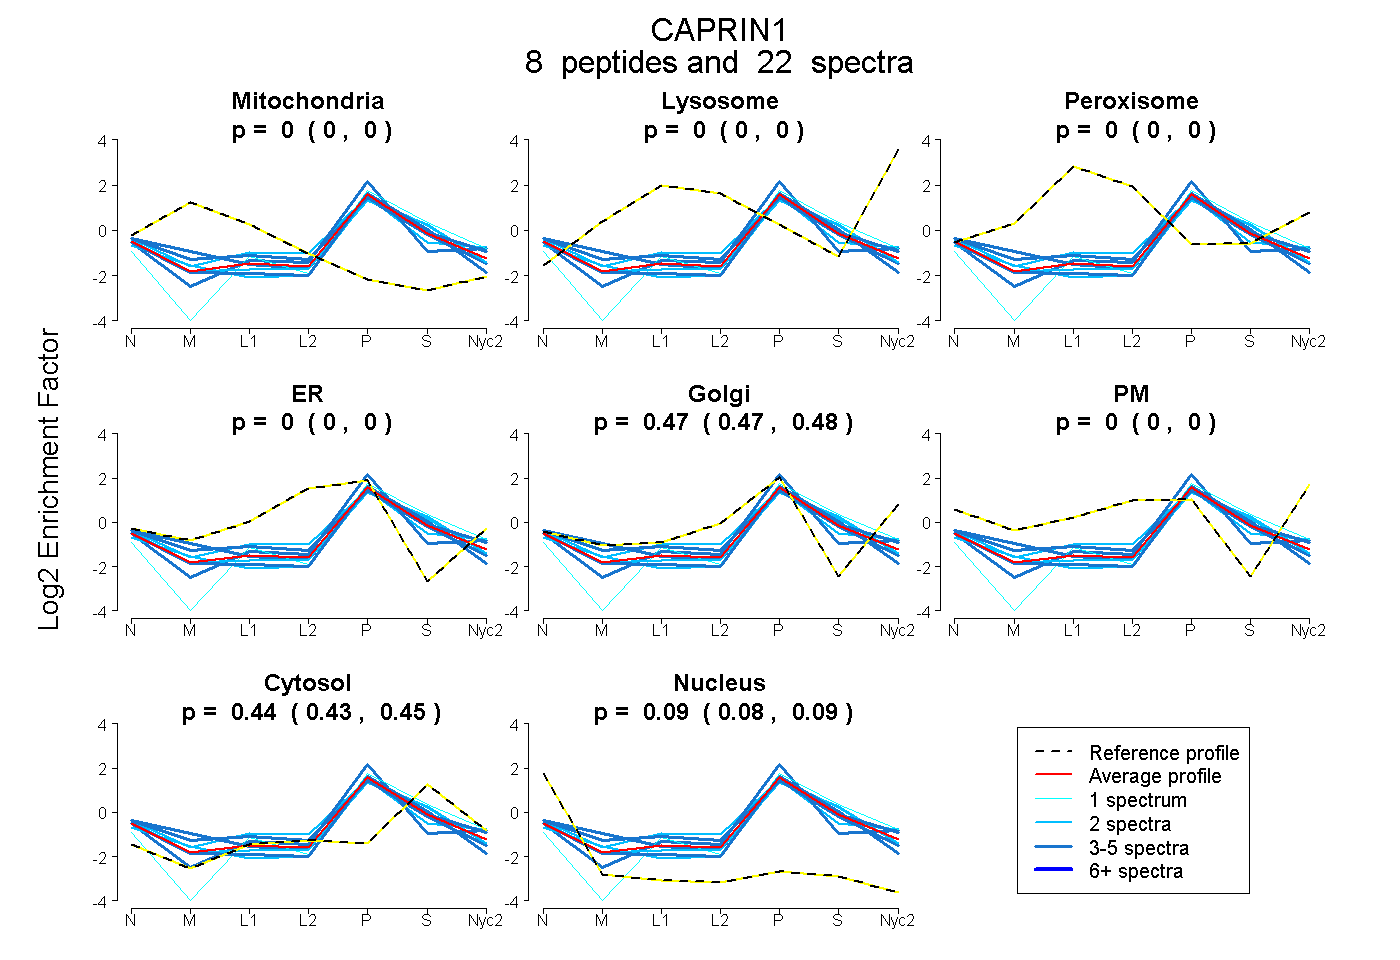 |
0.000
0.000 | 0.000 |
0.000
0.000 | 0.000 |
|
0.000
0.000 | 0.000 |
0.000
0.000 | 0.000 |
0.475
0.465 | 0.484 |
0.000
0.000 | 0.000 |
0.439
0.427 | 0.449 |
0.086
0.078 | 0.093 |
|
| | | Plot |
Mito |
|
Lyso or Perox |
|
ER |
Golgi |
PM |
Cytosol |
Nucleus |
|
| Expt B |
6
peptides |
9
spectra |
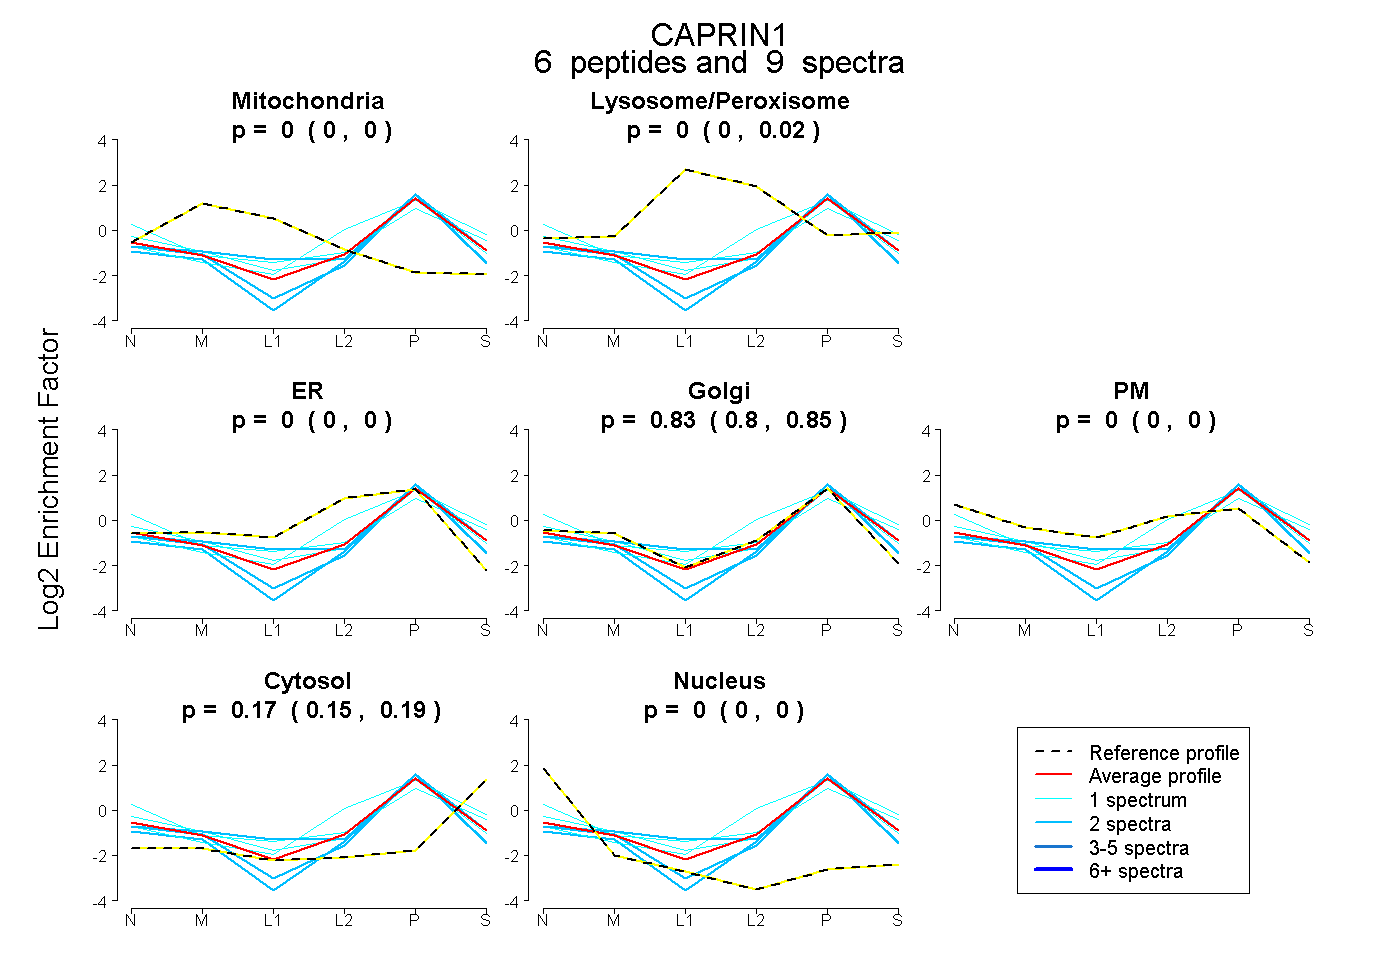 |
0.000
0.000 | 0.000 |
|
0.000
0.000 | 0.015 |
|
0.000
0.000 | 0.000 |
0.829
0.803 | 0.847 |
0.000
0.000 | 0.000 |
0.171
0.146 | 0.190 |
0.000
0.000 | 0.000 |
|
| 1 spectrum, LNQDQLDAVSK |
0.000 |
|
0.038 |
|
0.000 |
0.418 |
0.310 |
0.234 |
0.000 |
|
| 2 spectra, LGDDDVR |
0.000 |
|
0.000 |
|
0.000 |
0.805 |
0.000 |
0.195 |
0.000 |
|
| 2 spectra, YQEVTNNLEFAK |
0.000 |
|
0.071 |
|
0.000 |
0.865 |
0.000 |
0.063 |
0.000 |
|
| 1 spectrum, QILGVIDK |
0.000 |
|
0.000 |
|
0.440 |
0.258 |
0.000 |
0.302 |
0.000 |
|
| 2 spectra, LDDYQER |
0.000 |
|
0.000 |
|
0.000 |
0.887 |
0.000 |
0.113 |
0.000 |
|
| 1 spectrum, EKPVCGTTYK |
0.000 |
|
0.030 |
|
0.000 |
0.833 |
0.000 |
0.137 |
0.000 |
|
| | | Plot |
|
Lyso |
|
|
|
|
|
|
|
Other |
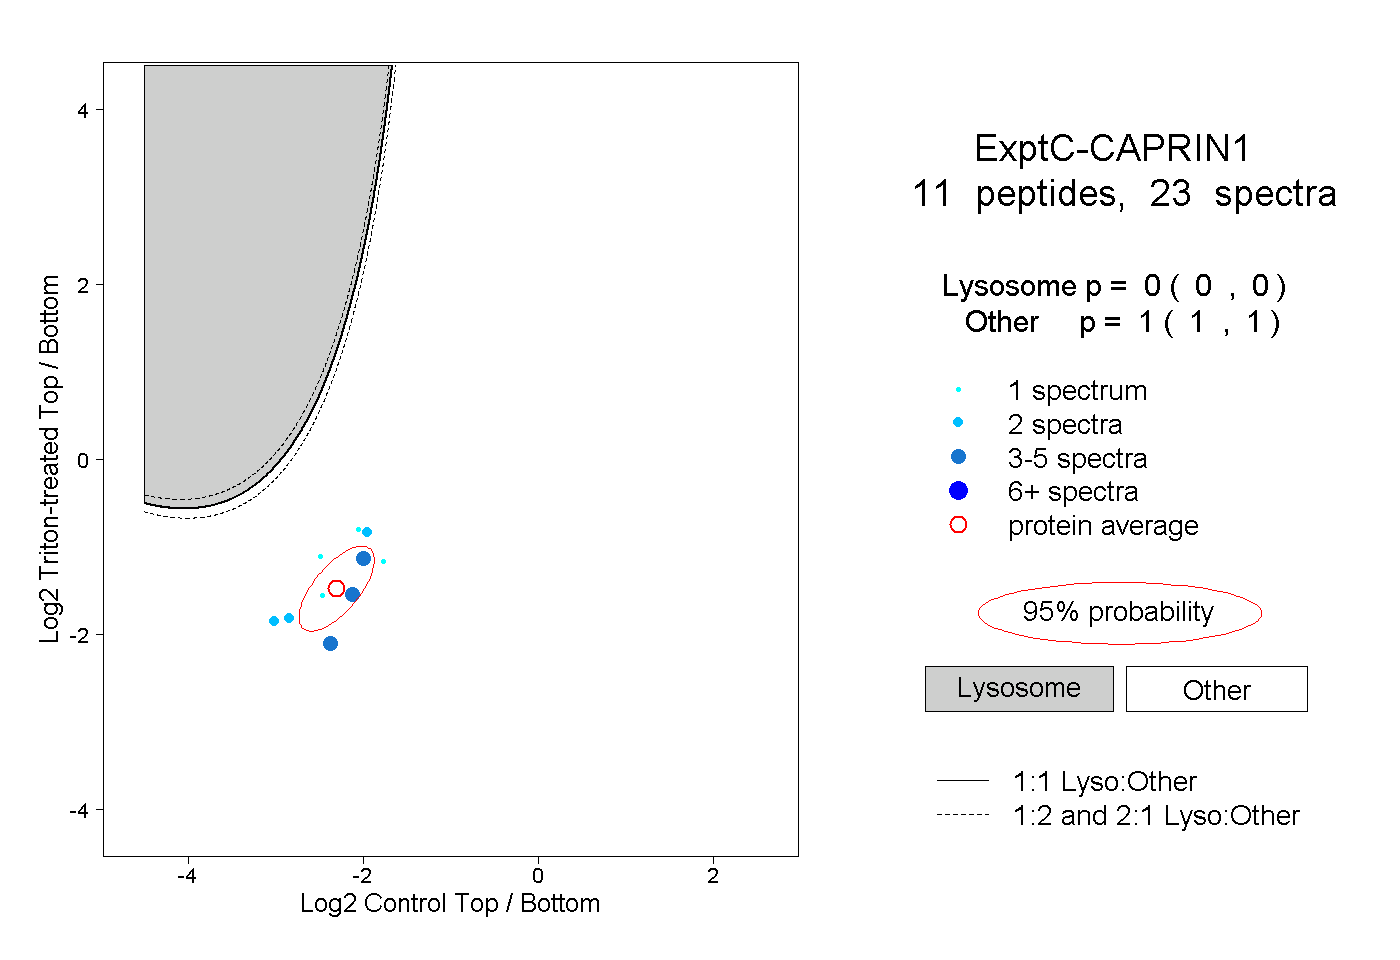
| Expt C |
11
peptides |
23
spectra |
 |
|
0.000
0.000 | 0.000 |
|
|
|
|
|
|
|
1.000
1.000 | 1.000 |
| | | Plot |
|
Lyso |
|
|
|
|
|
|
|
Other |
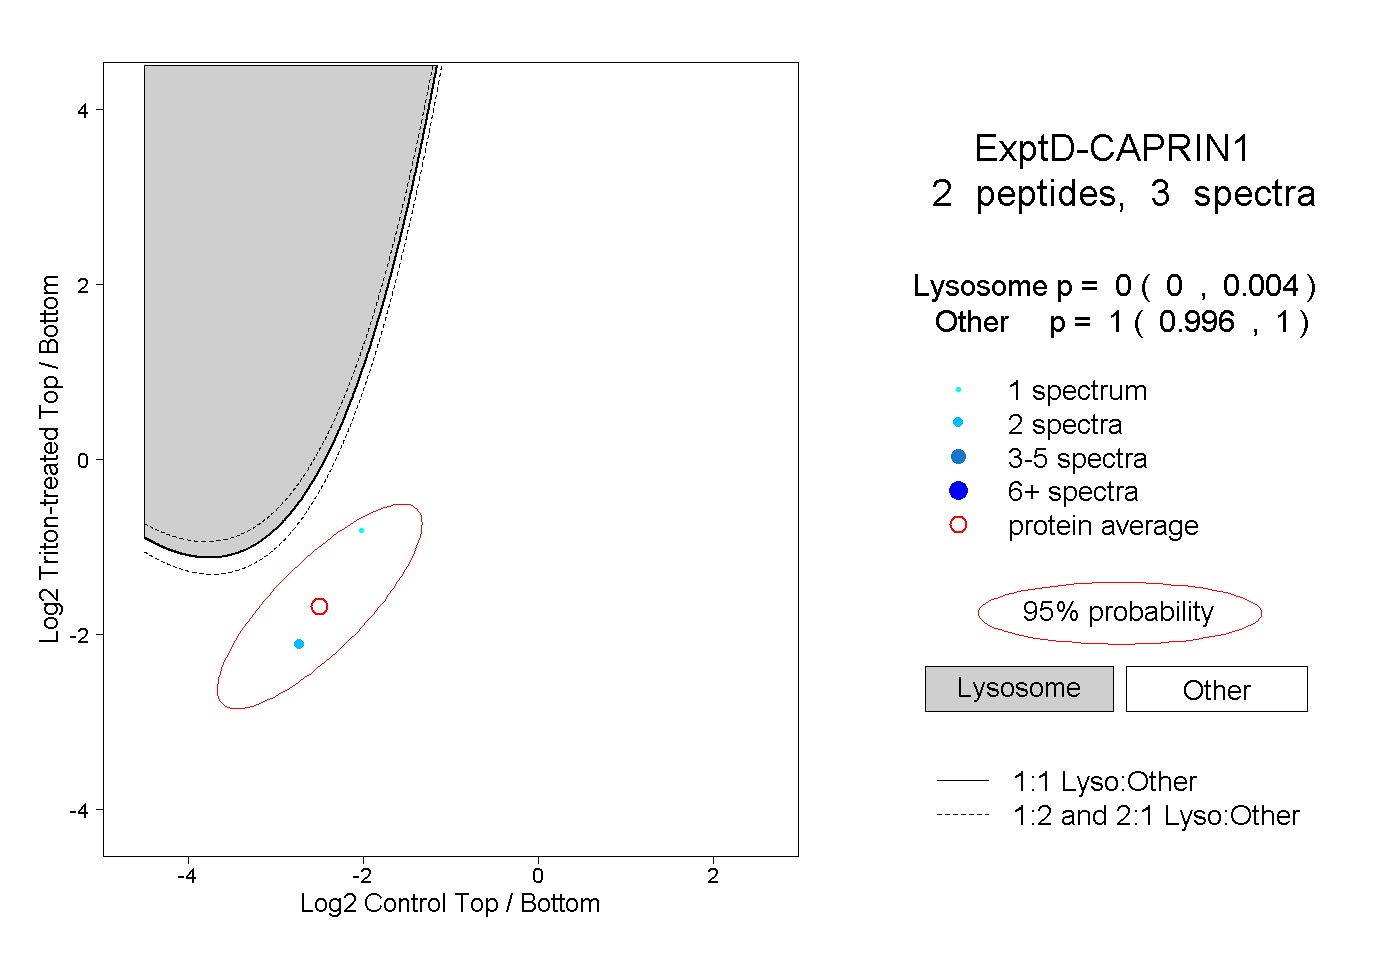
| Expt D |
2
peptides |
3
spectra |
 |
|
0.000
0.000 | 0.004 |
|
|
|
|
|
|
|
1.000
0.996 | 1.000 |