 4
4peptides
spectra
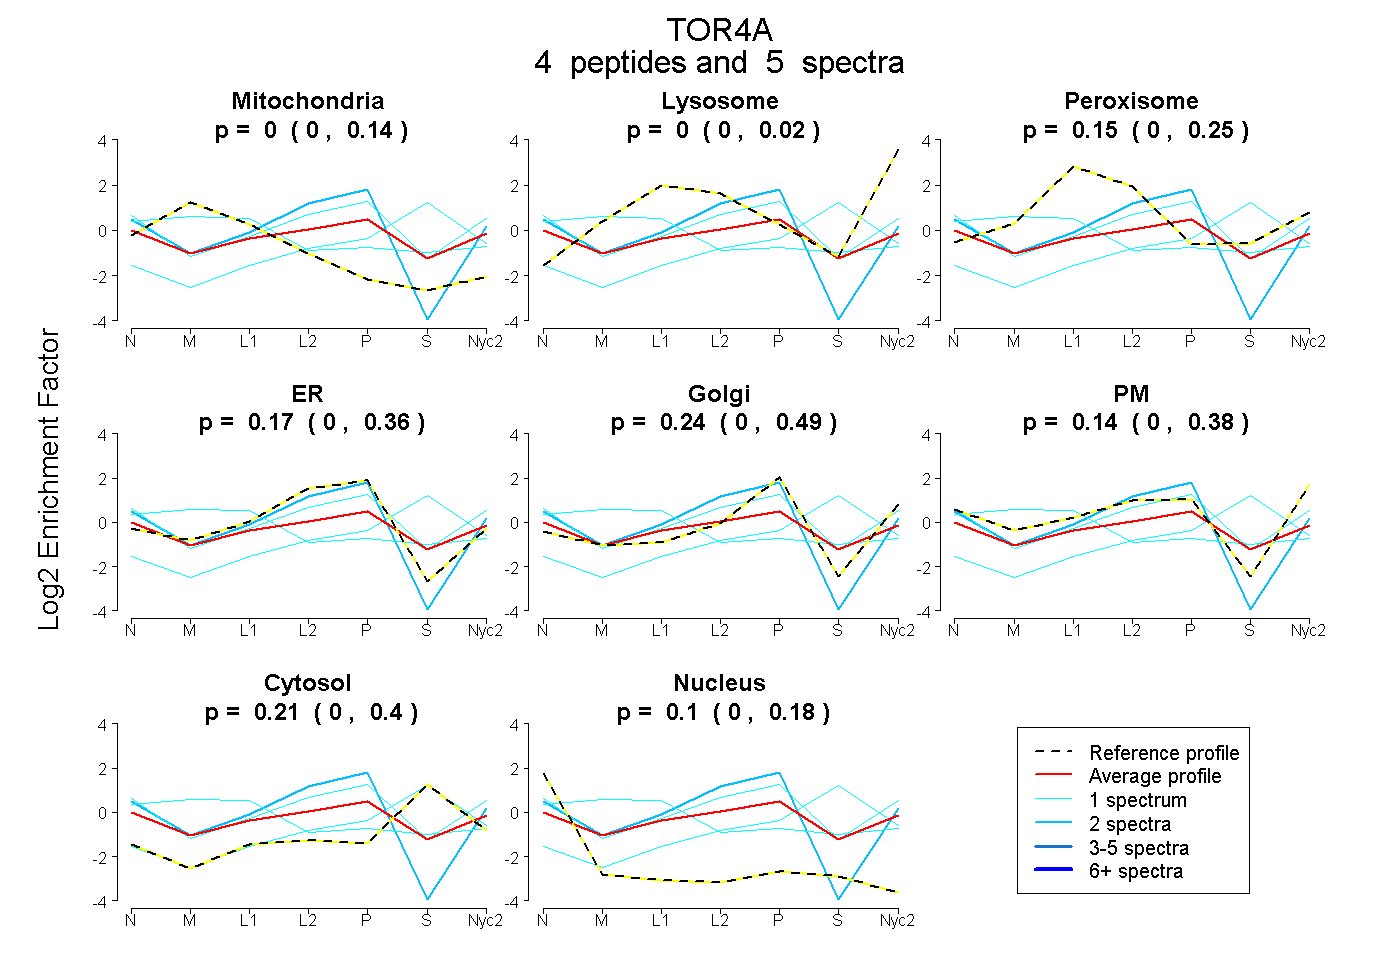
0.000 | 0.140
0.000 | 0.019
0.000 | 0.249
0.000 | 0.365
0.000 | 0.491
0.000 | 0.375
0.000 | 0.395
0.000 | 0.184
| Plot | Mito | Lyso | Perox | ER | Golgi | PM | Cytosol | Nucleus | |||||
| Expt A |
4 peptides |
5 spectra |
|
0.000 0.000 | 0.140 |
0.000 0.000 | 0.019 |
0.151 0.000 | 0.249 |
0.172 0.000 | 0.365 |
0.236 0.000 | 0.491 |
0.136 0.000 | 0.375 |
0.207 0.000 | 0.395 |
0.098 0.000 | 0.184 |
| 1 spectrum, VADVVAQAEAEEK | 0.000 | 0.000 | 0.000 | 0.261 | 0.034 | 0.498 | 0.206 | 0.000 | ||
| 2 spectra, SVFGQPAAVSR | 0.000 | 0.000 | 0.000 | 0.703 | 0.000 | 0.250 | 0.000 | 0.047 | ||
| 1 spectrum, TQTEESPALEELQTSLR | 0.488 | 0.000 | 0.140 | 0.000 | 0.000 | 0.194 | 0.178 | 0.000 | ||
| 1 spectrum, MLPSLR | 0.000 | 0.000 | 0.000 | 0.001 | 0.137 | 0.000 | 0.862 | 0.000 |
| Plot | Lyso | Other | |||||||||||
| Expt C |
1 peptide |
1 spectrum |
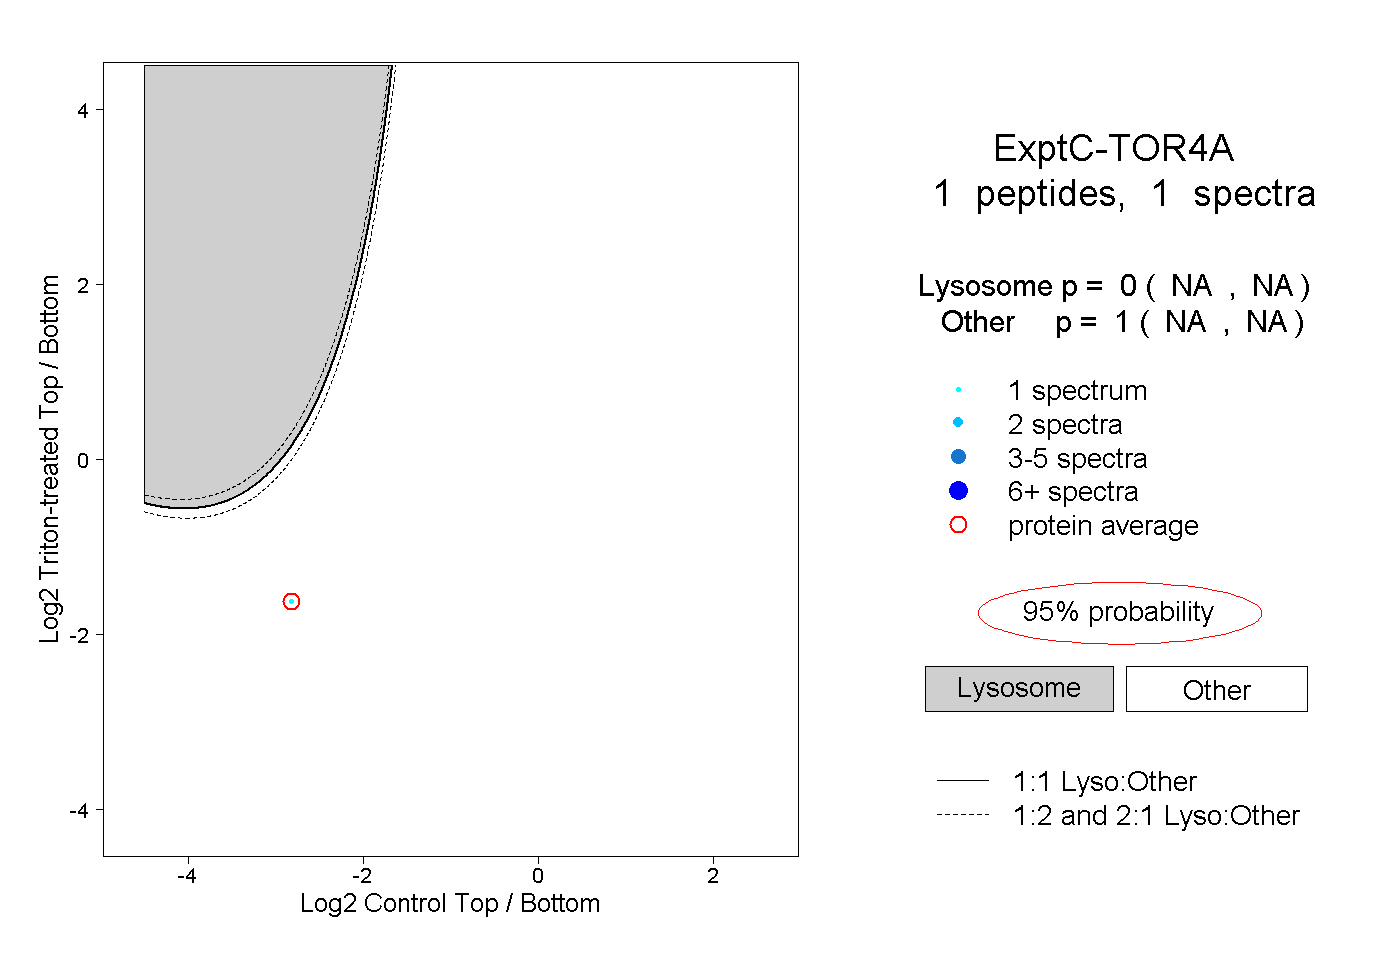 |
0.000 NA | NA |
1.000 NA | NA |