 22
22peptides
spectra
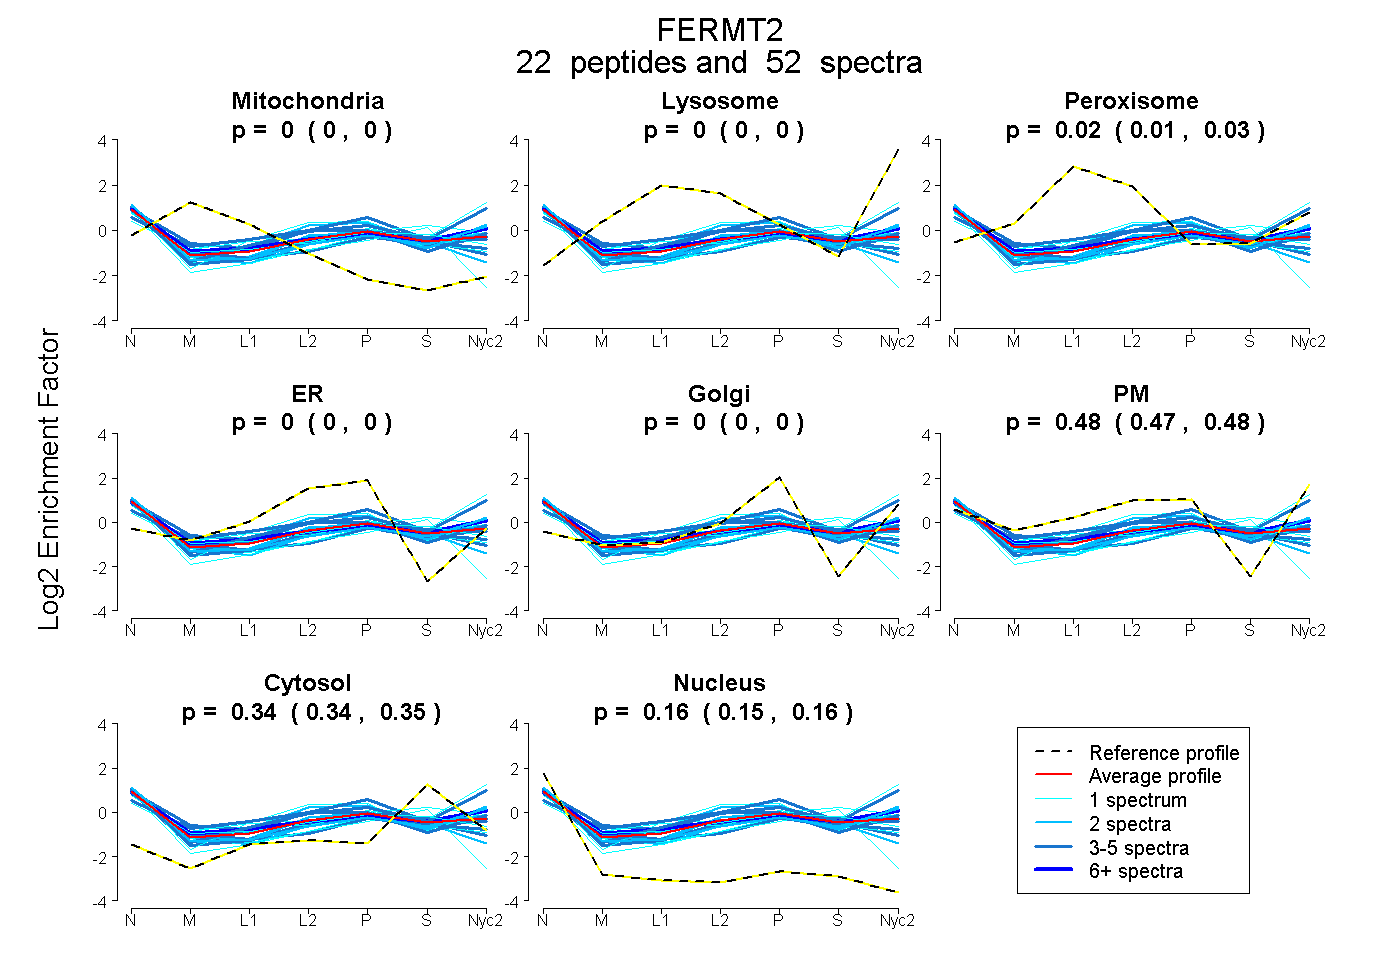
0.000 | 0.000
0.000 | 0.000
0.014 | 0.026
0.000 | 0.000
0.000 | 0.000
0.470 | 0.484
0.339 | 0.347
0.153 | 0.162
3peptides
spectra
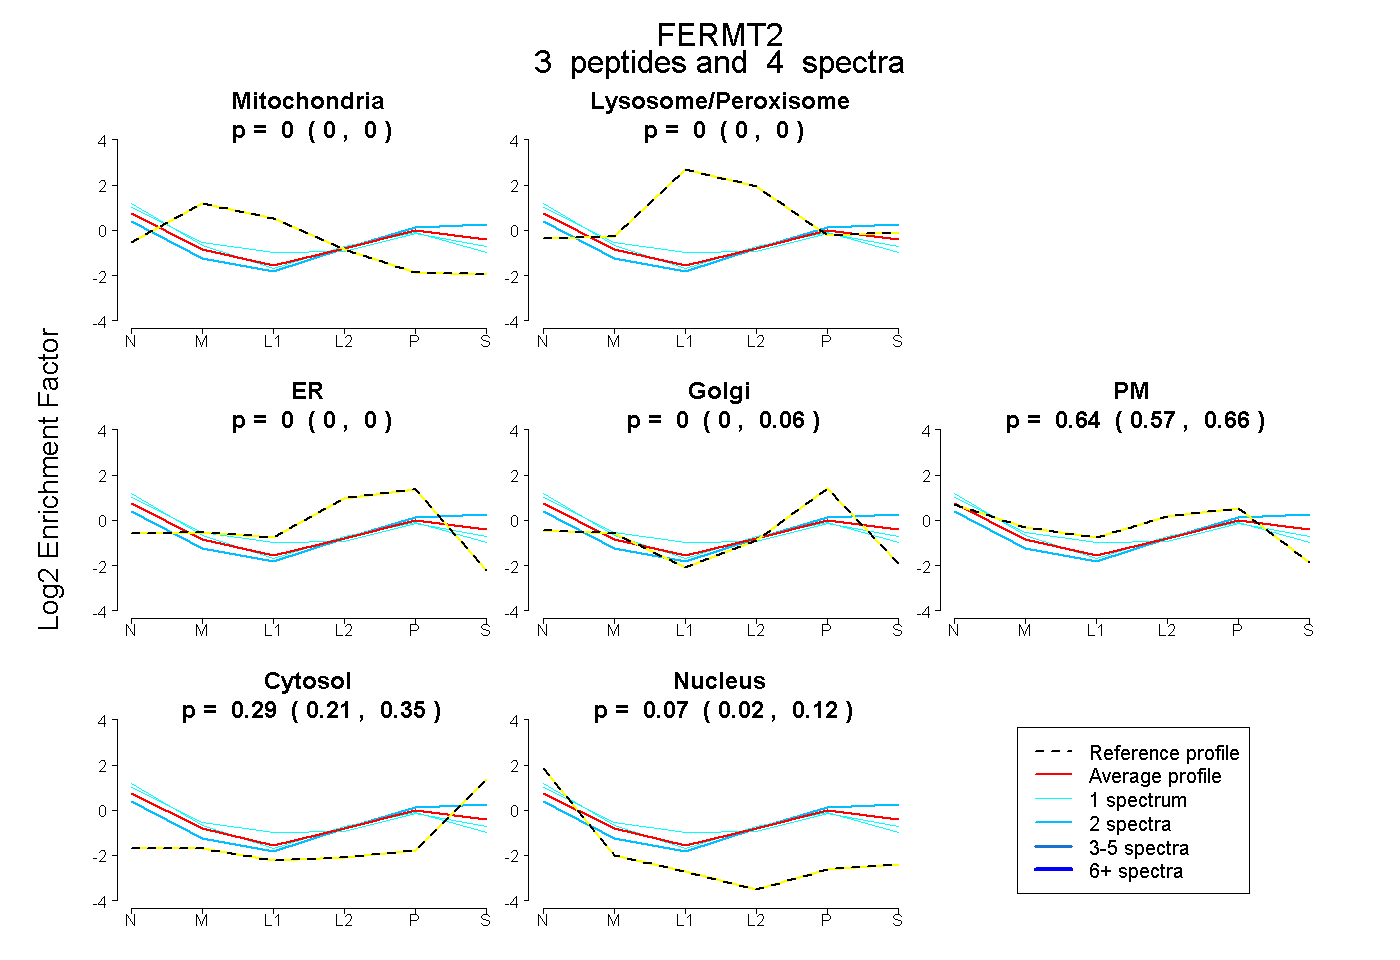
0.000 | 0.000
0.000 | 0.000
0.000 | 0.000
0.000 | 0.057
0.573 | 0.665
0.207 | 0.353
0.019 | 0.116
21peptides
spectra
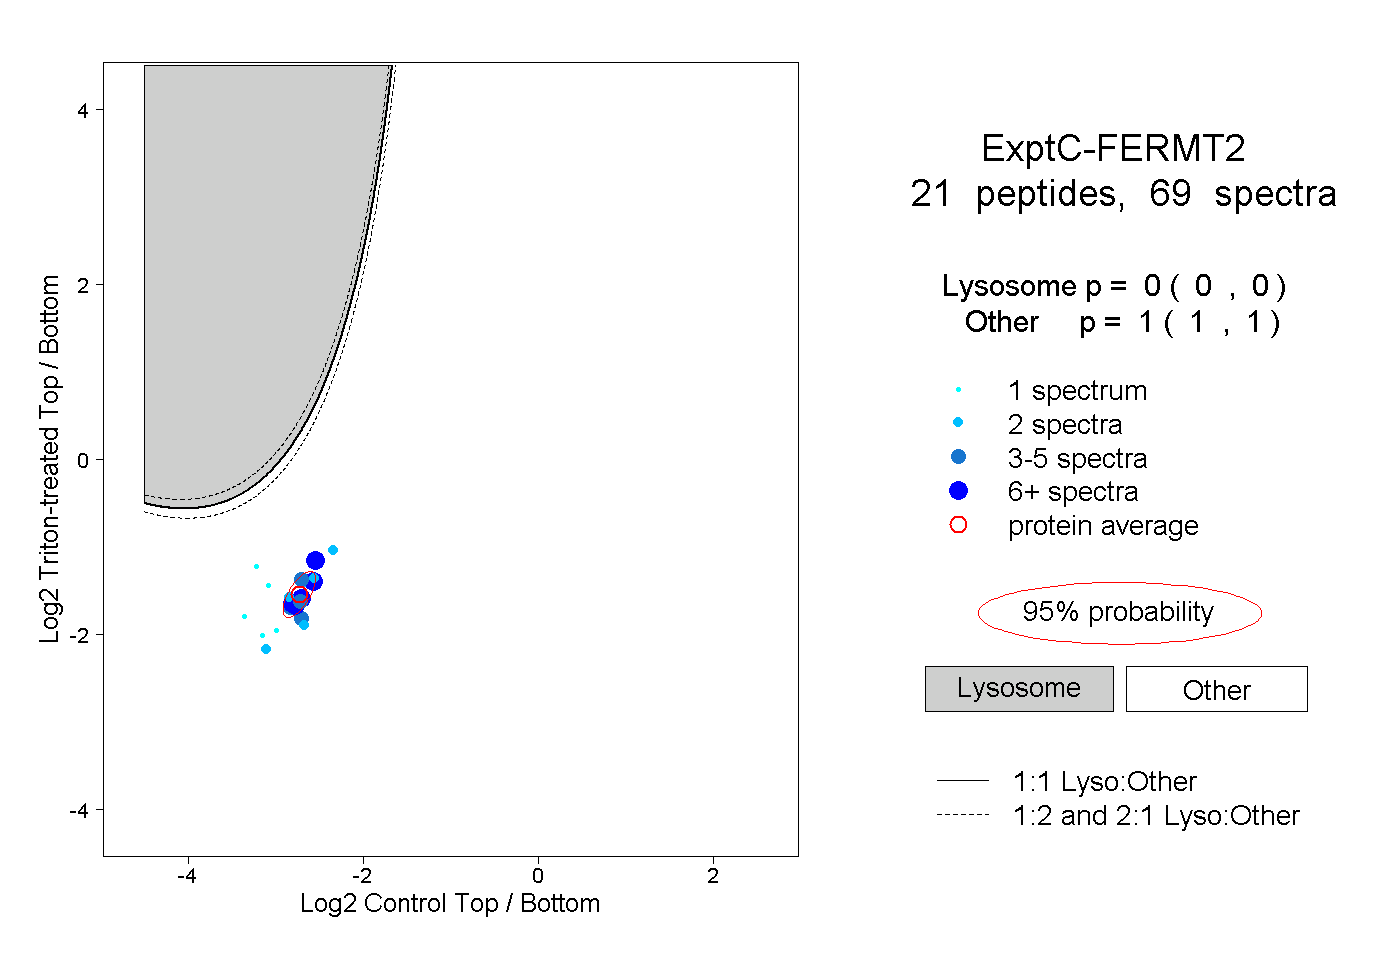
0.000 | 0.000
1.000 | 1.000
2peptides
spectra
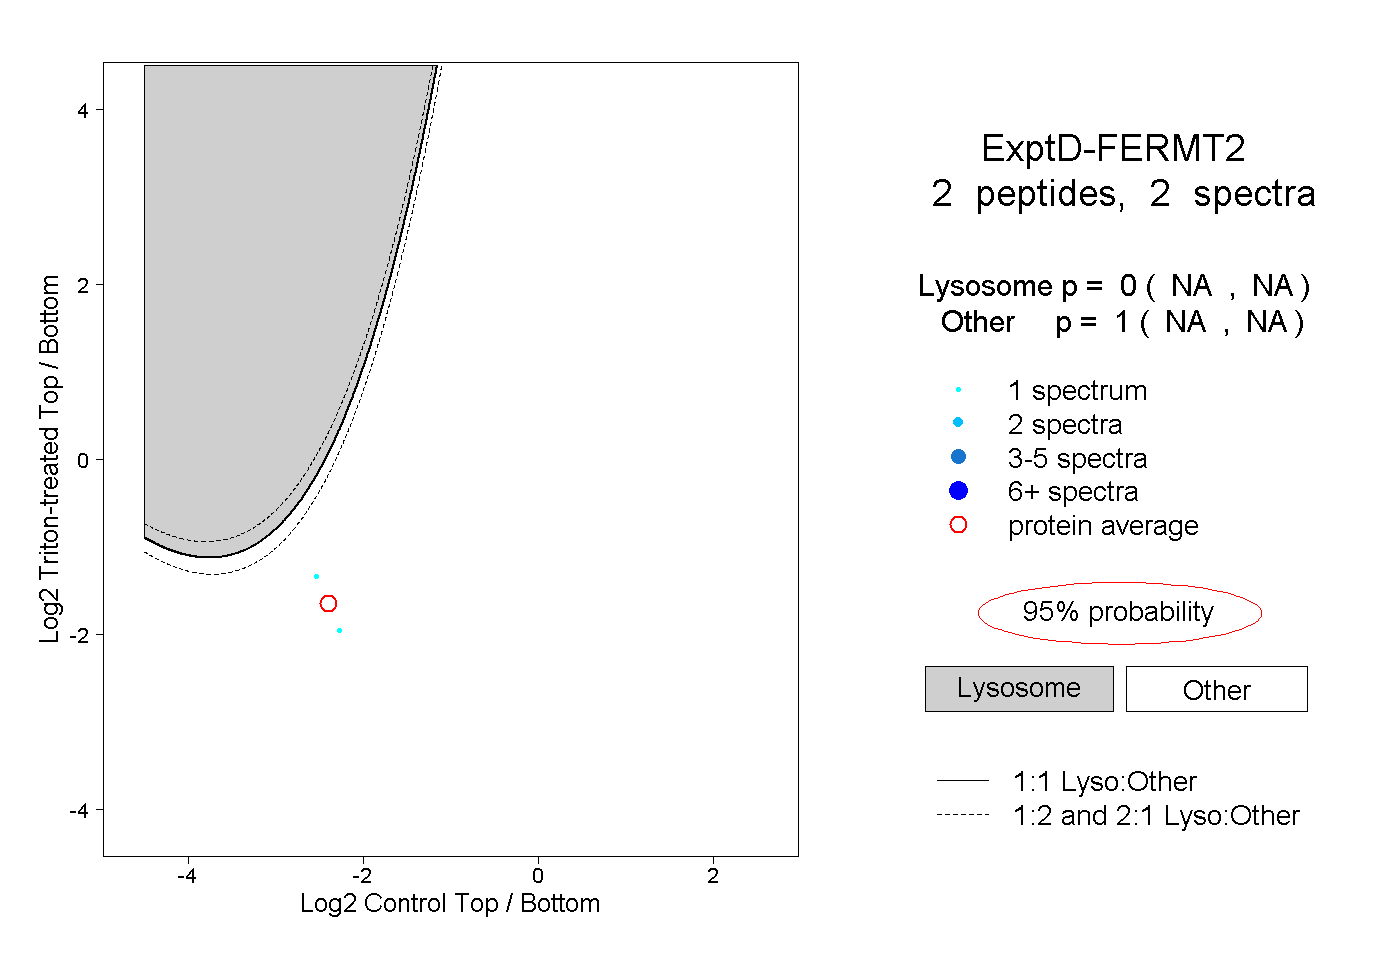
NA | NA
NA | NA