 2
2peptides
spectra
0.000 | 0.000
0.000 | 0.000
0.000 | 0.000
0.000 | 0.000
0.000 | 0.000
0.000 | 0.000
0.338 | 0.381
0.614 | 0.659
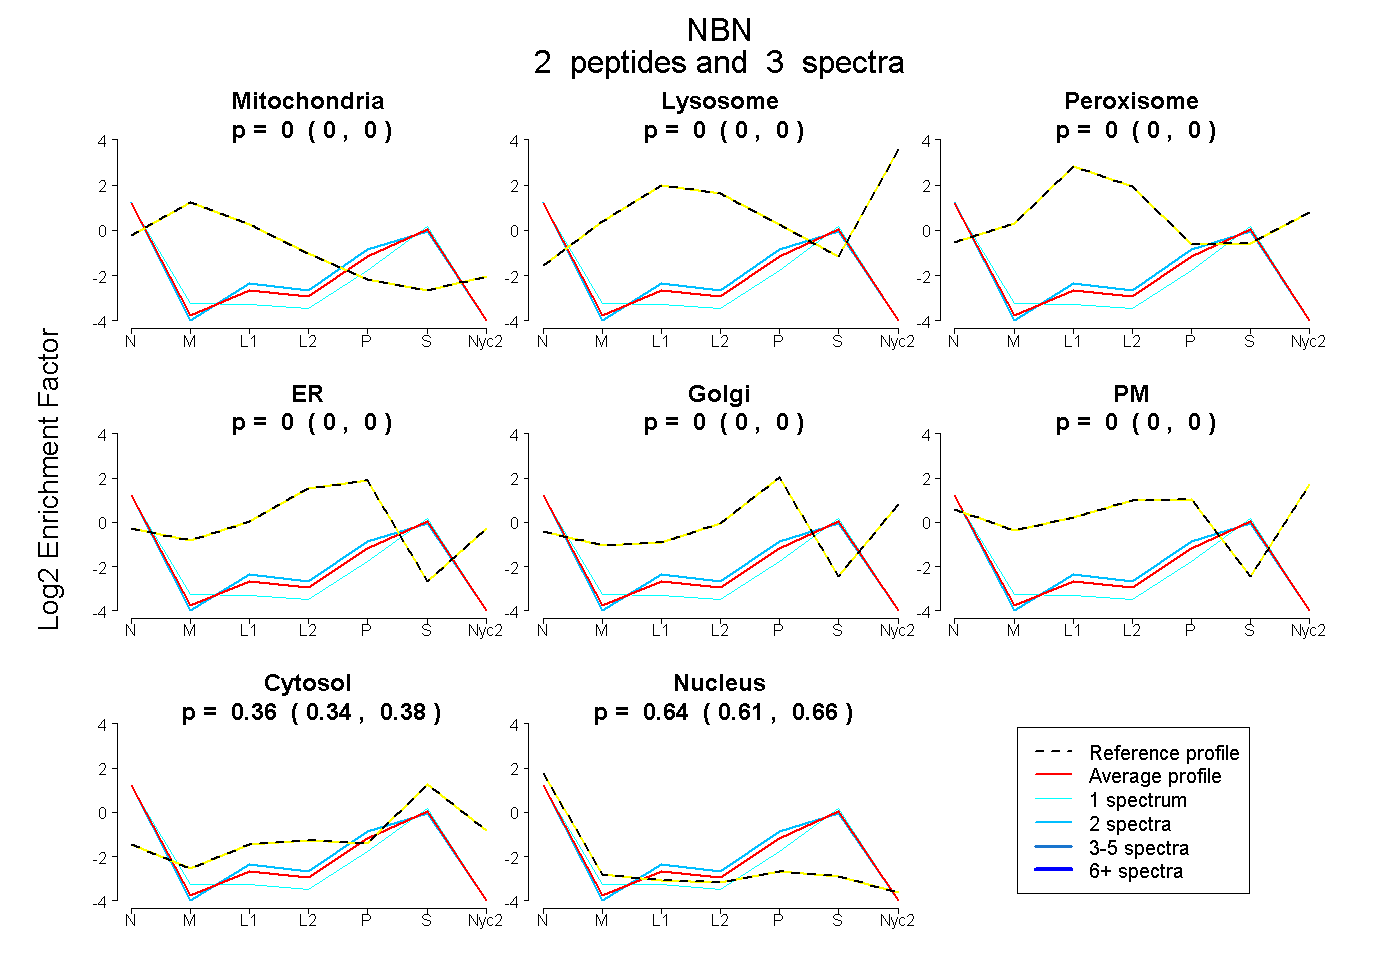
| Plot | Mito | Lyso | Perox | ER | Golgi | PM | Cytosol | Nucleus | |||||
| Expt A |
2 peptides |
3 spectra |
|
0.000 0.000 | 0.000 |
0.000 0.000 | 0.000 |
0.000 0.000 | 0.000 |
0.000 0.000 | 0.000 |
0.000 0.000 | 0.000 |
0.000 0.000 | 0.000 |
0.362 0.338 | 0.381 |
0.638 0.614 | 0.659 |
| 2 spectra, EDSLADDLFR | 0.000 | 0.000 | 0.000 | 0.000 | 0.000 | 0.000 | 0.383 | 0.617 | ||
| 1 spectrum, LLAGVEYIVGR | 0.000 | 0.000 | 0.000 | 0.000 | 0.000 | 0.000 | 0.318 | 0.682 |