 22
22peptides
spectra
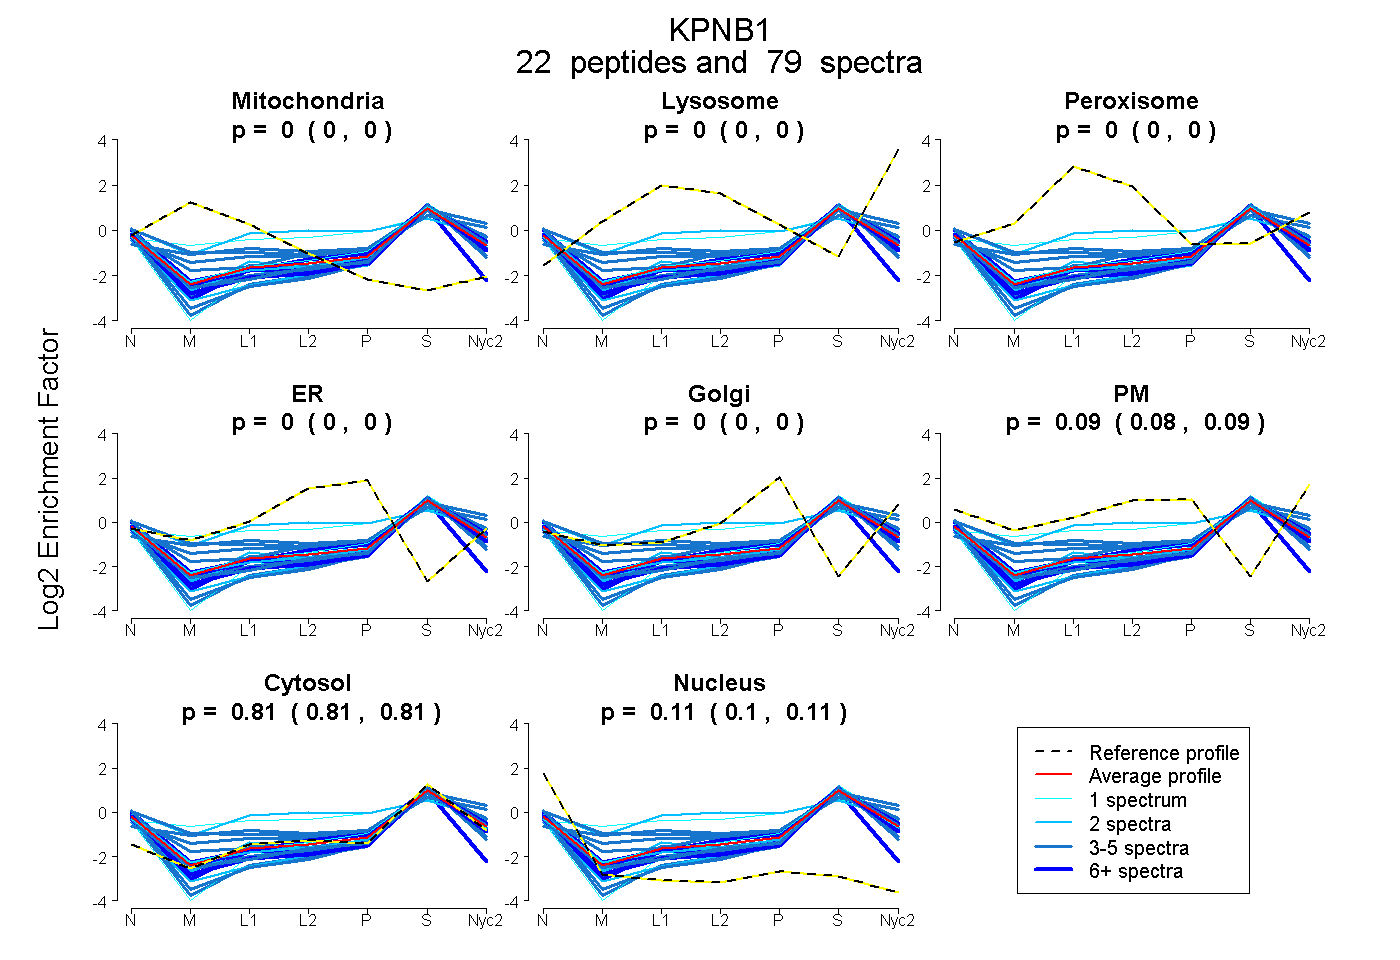
0.000 | 0.000
0.000 | 0.000
0.000 | 0.000
0.000 | 0.000
0.000 | 0.000
0.082 | 0.088
0.807 | 0.812
0.102 | 0.108
14peptides
spectra
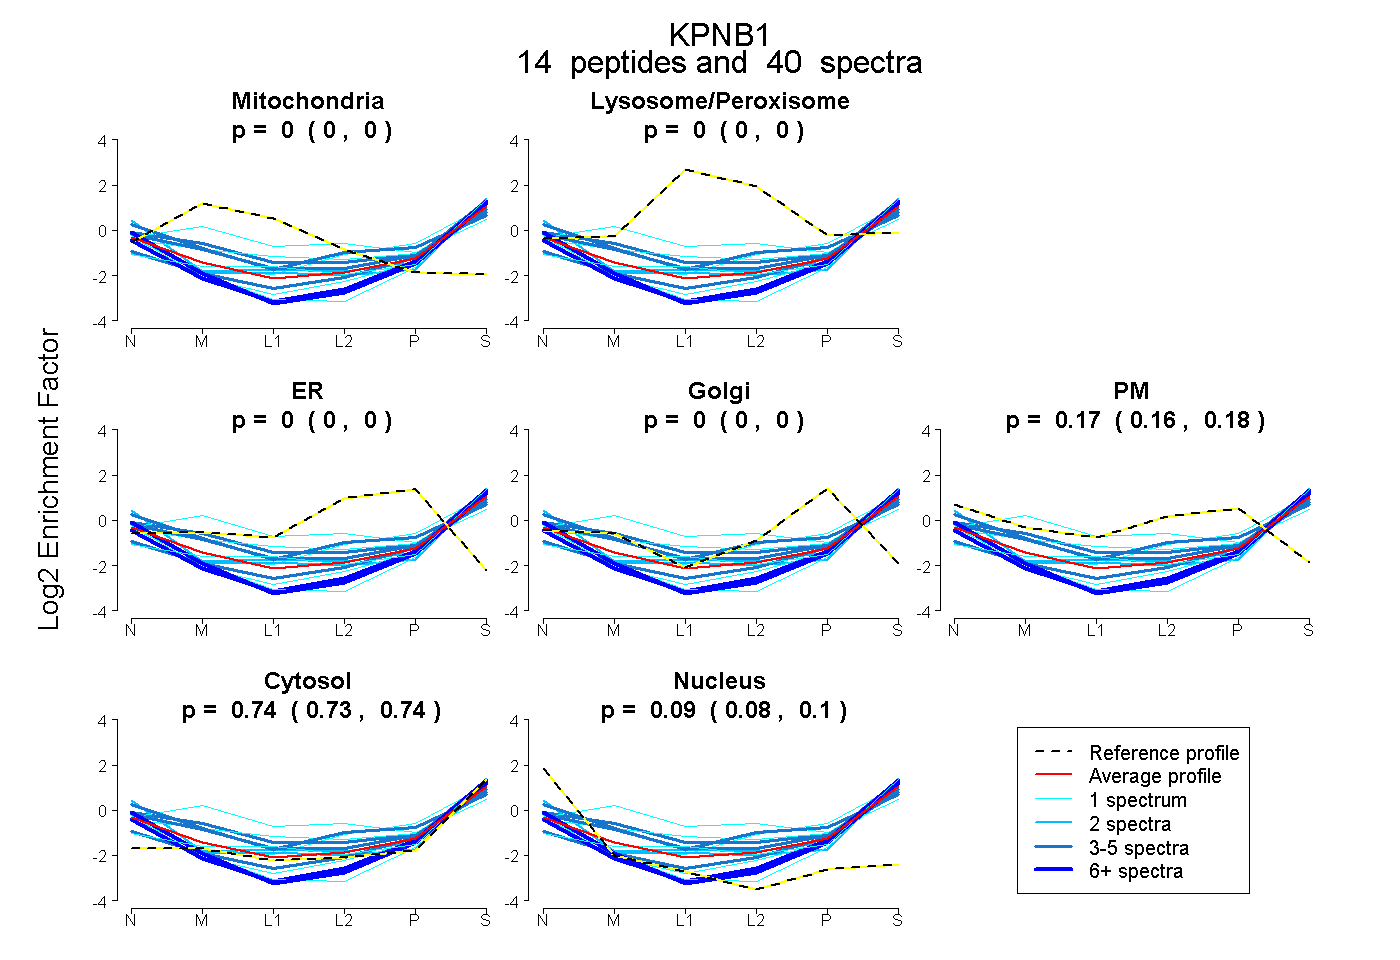
0.000 | 0.000
0.000 | 0.001
0.000 | 0.000
0.000 | 0.000
0.160 | 0.180
0.732 | 0.744
0.080 | 0.098
16peptides
spectra
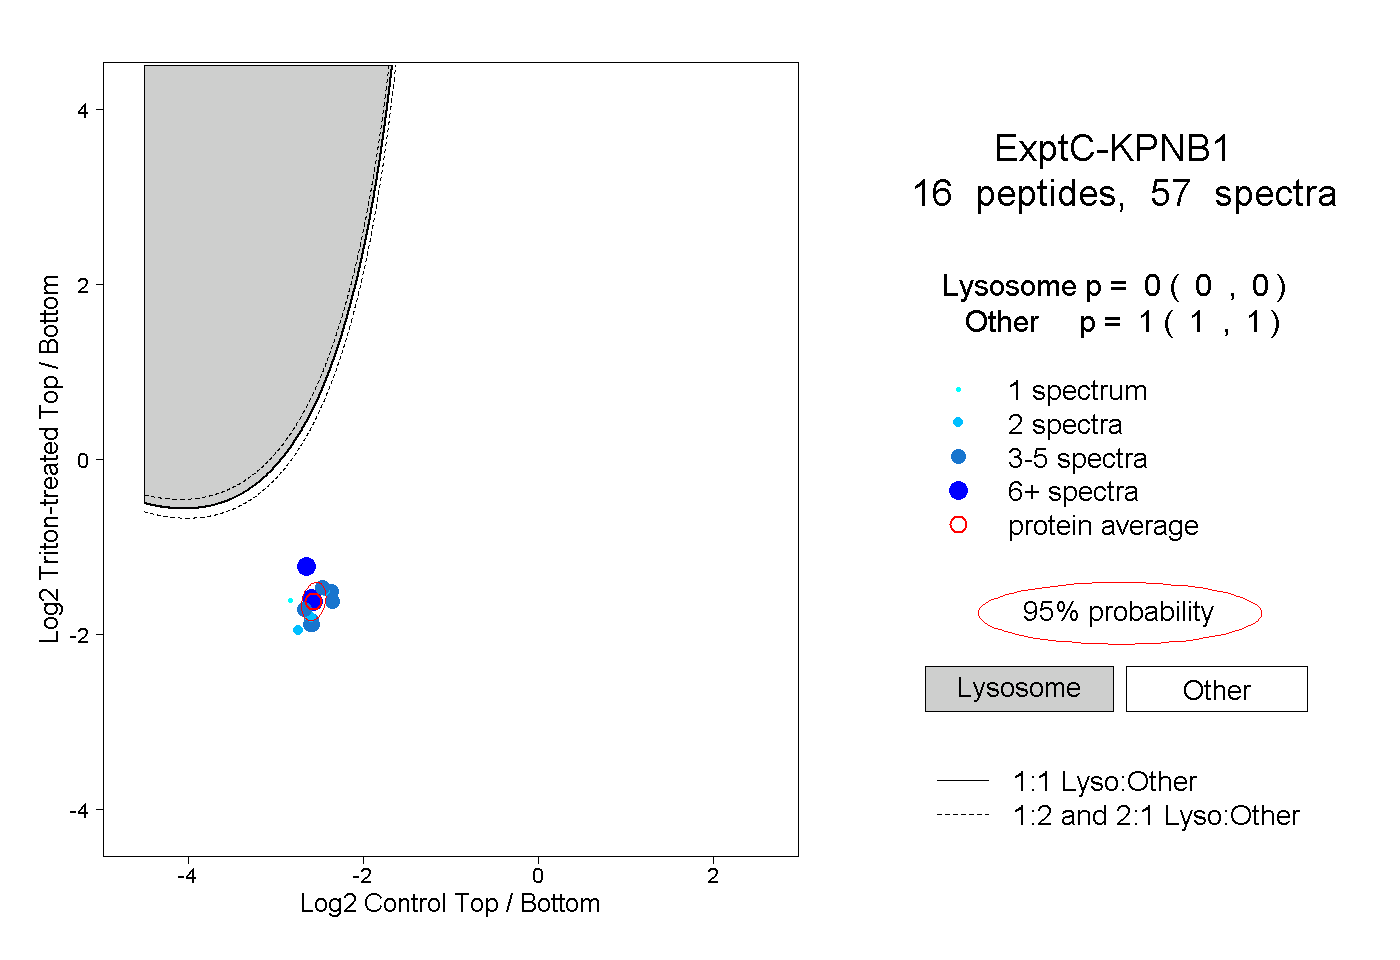
0.000 | 0.000
1.000 | 1.000
4peptides
spectra
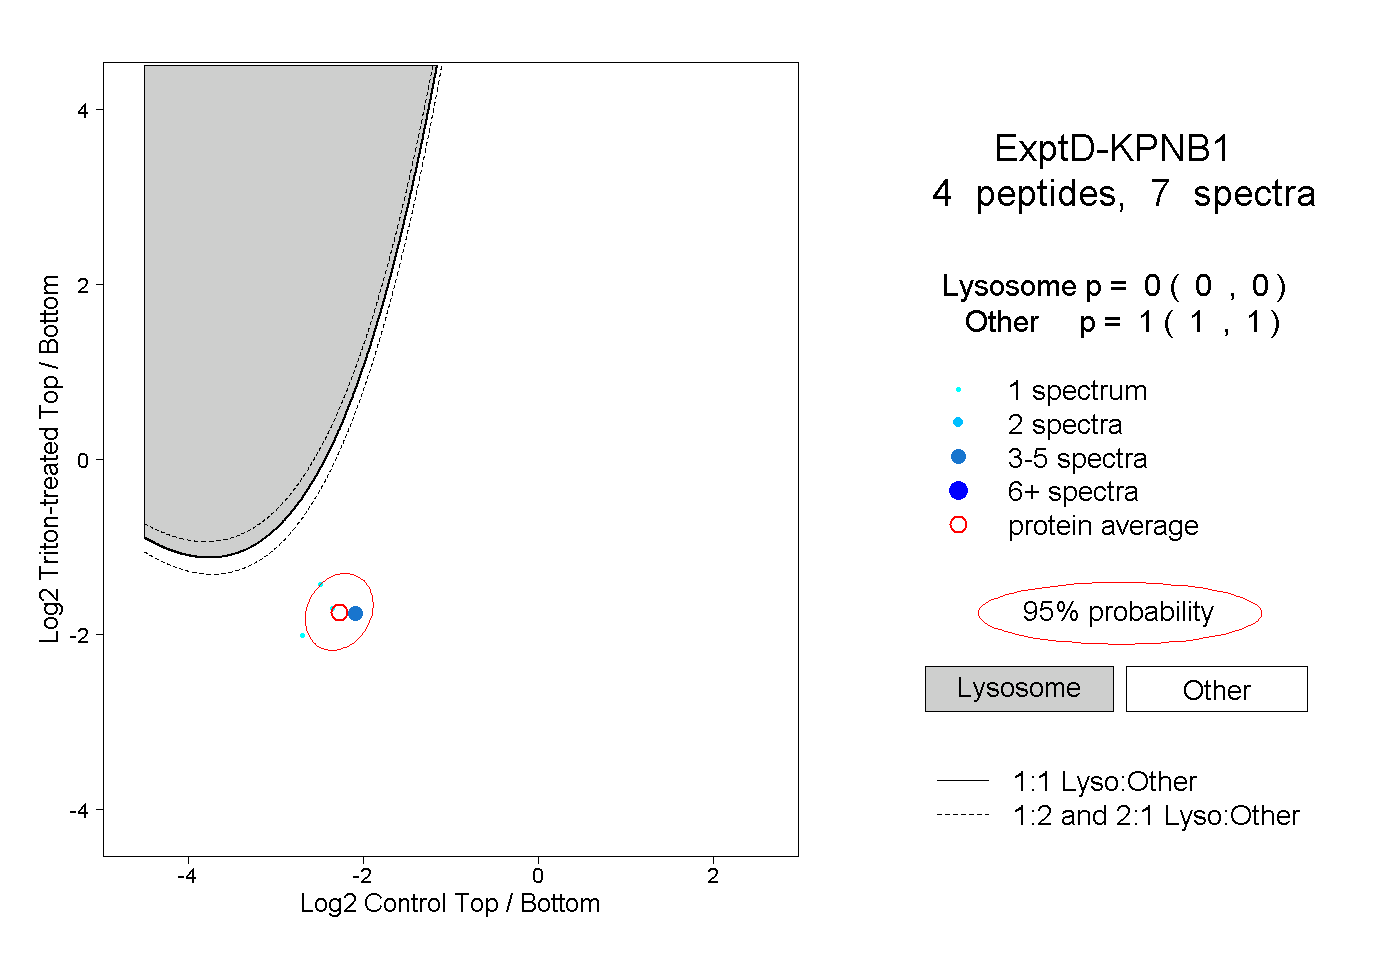
0.000 | 0.000
1.000 | 1.000