 1
1peptide
spectrum
NA | NA
NA | NA
NA | NA
NA | NA
NA | NA
NA | NA
NA | NA
NA | NA
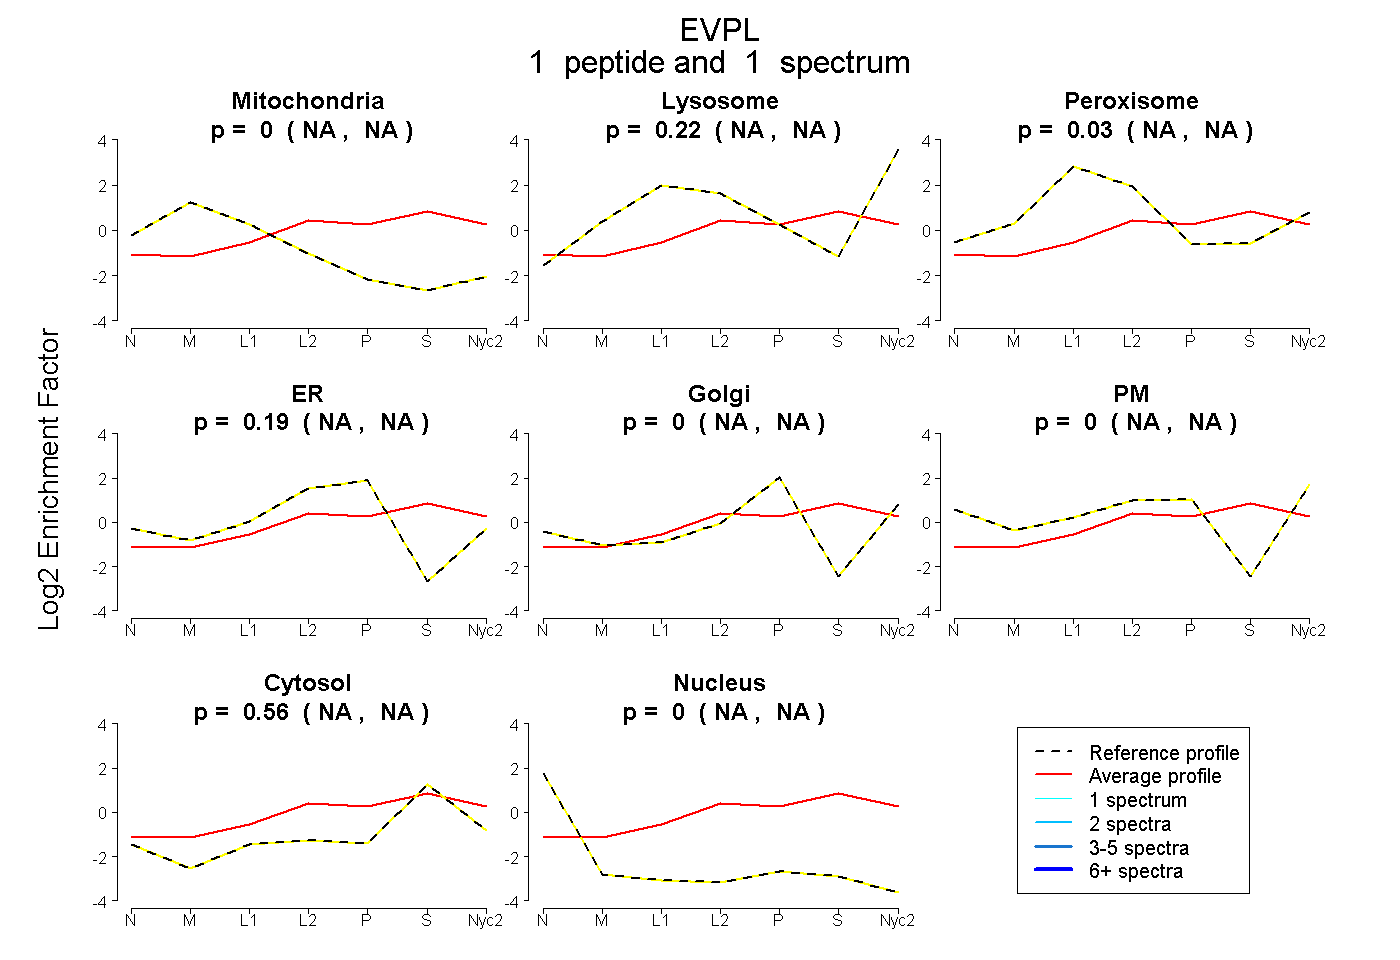
| Plot | Mito | Lyso | Perox | ER | Golgi | PM | Cytosol | Nucleus | |||||
| Expt A |
1 peptide |
1 spectrum |
|
0.000 NA | NA |
0.216 NA | NA |
0.030 NA | NA |
0.194 NA | NA |
0.000 NA | NA |
0.000 NA | NA |
0.559 NA | NA |
0.000 NA | NA |
| 1 spectrum, LLEAQAATGGIVDLLSR | 0.000 | 0.216 | 0.030 | 0.194 | 0.000 | 0.000 | 0.559 | 0.000 |
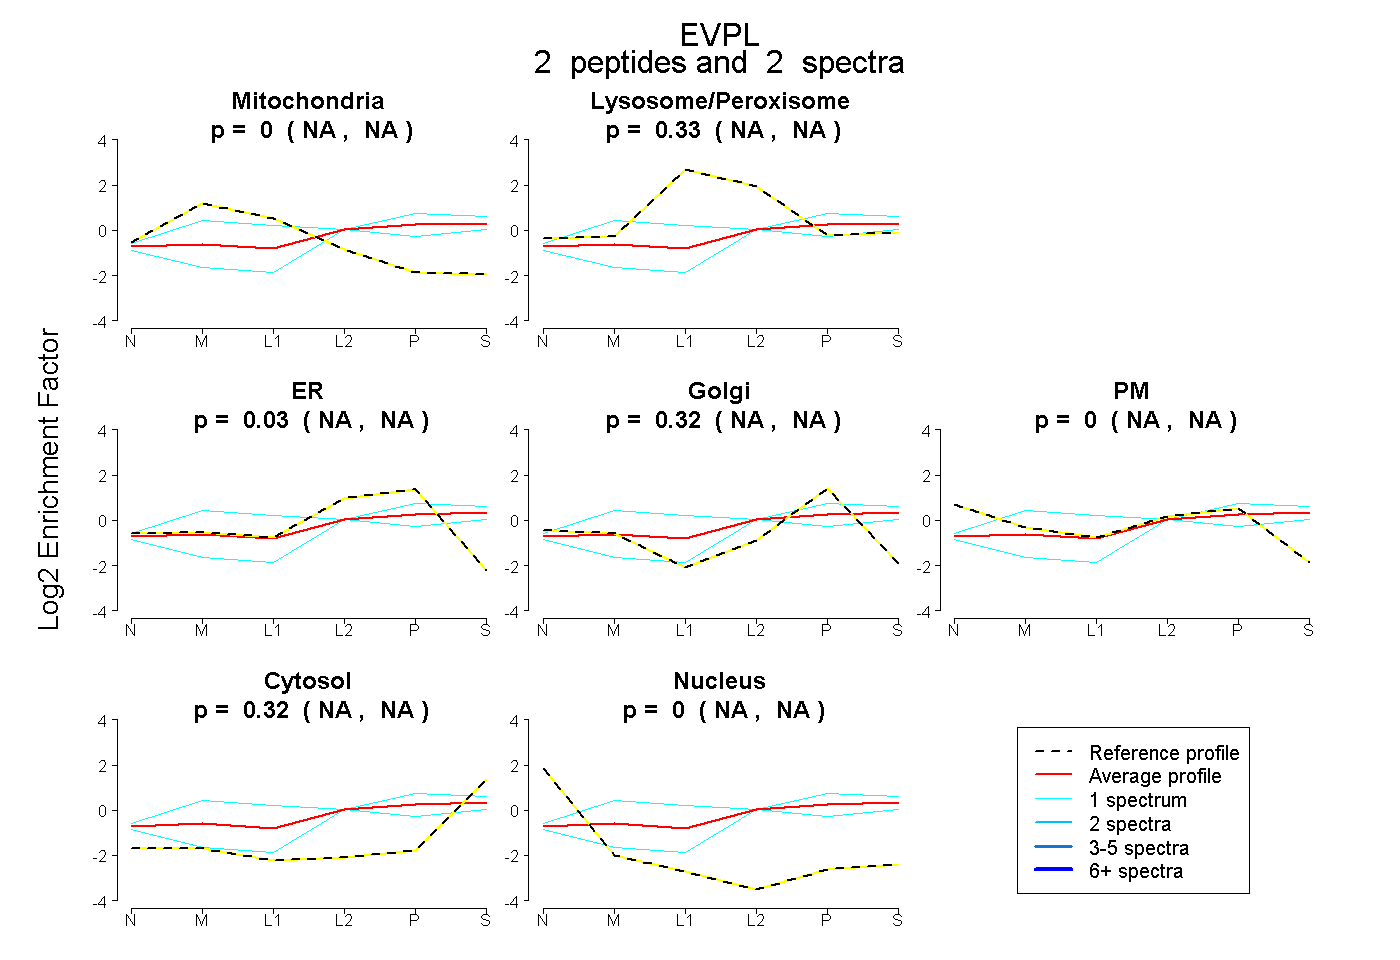
| Plot | Mito | Lyso or Perox | ER | Golgi | PM | Cytosol | Nucleus | ||||||
| Expt B |
2 peptides |
2 spectra |
 |
0.000 NA | NA |
0.328 NA | NA |
0.027 NA | NA |
0.321 NA | NA |
0.000 NA | NA |
0.323 NA | NA |
0.000 NA | NA |
|||
| Plot | Lyso | Other | |||||||||||
| Expt C |
1 peptide |
1 spectrum |
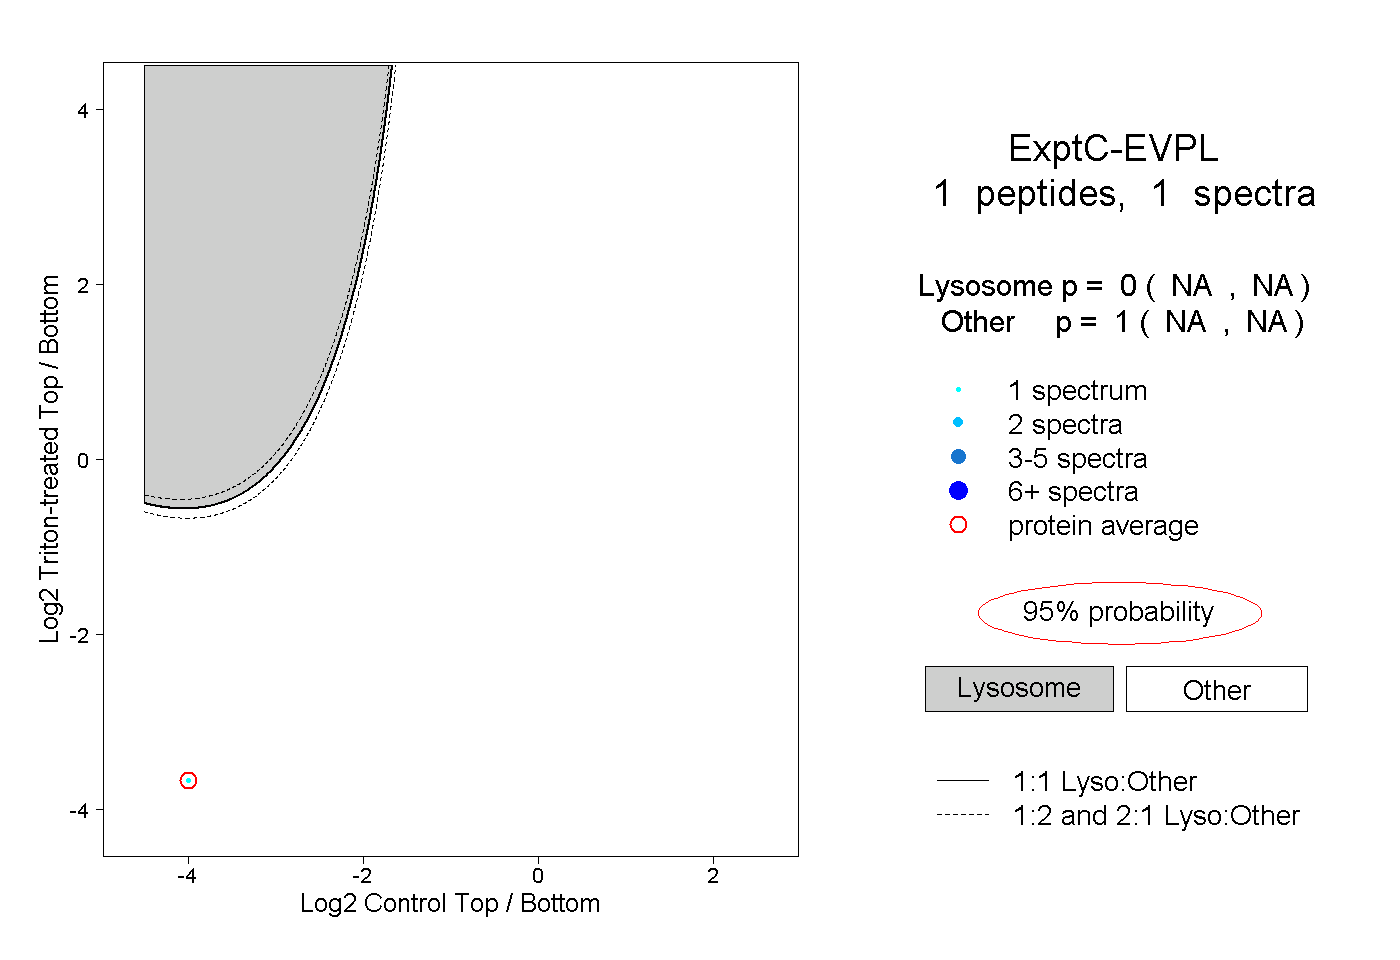 |
0.000 NA | NA |
1.000 NA | NA |
||||||||
| Plot | Lyso | Other | |||||||||||
| Expt D |
2 peptides |
3 spectra |
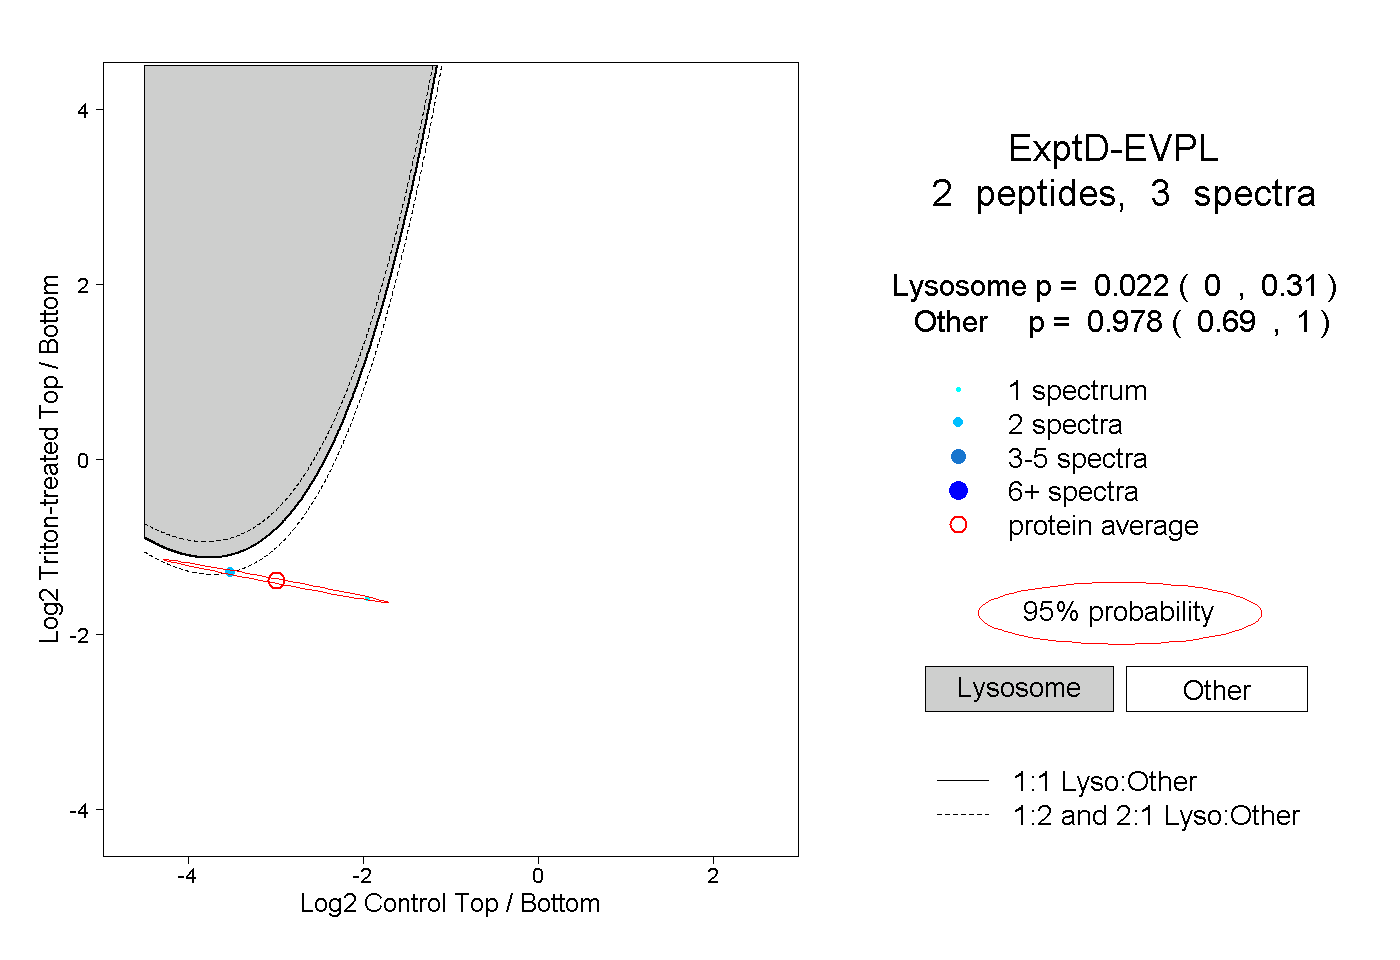 |
0.022 0.000 | 0.310 |
0.978 0.690 | 1.000 |