 6
6peptides
spectra
0.000 | 0.000
0.000 | 0.000
0.000 | 0.000
0.000 | 0.000
0.000 | 0.000
0.000 | 0.011
0.969 | 0.975
0.017 | 0.025
| Plot | Mito | Lyso | Perox | ER | Golgi | PM | Cytosol | Nucleus | |||||
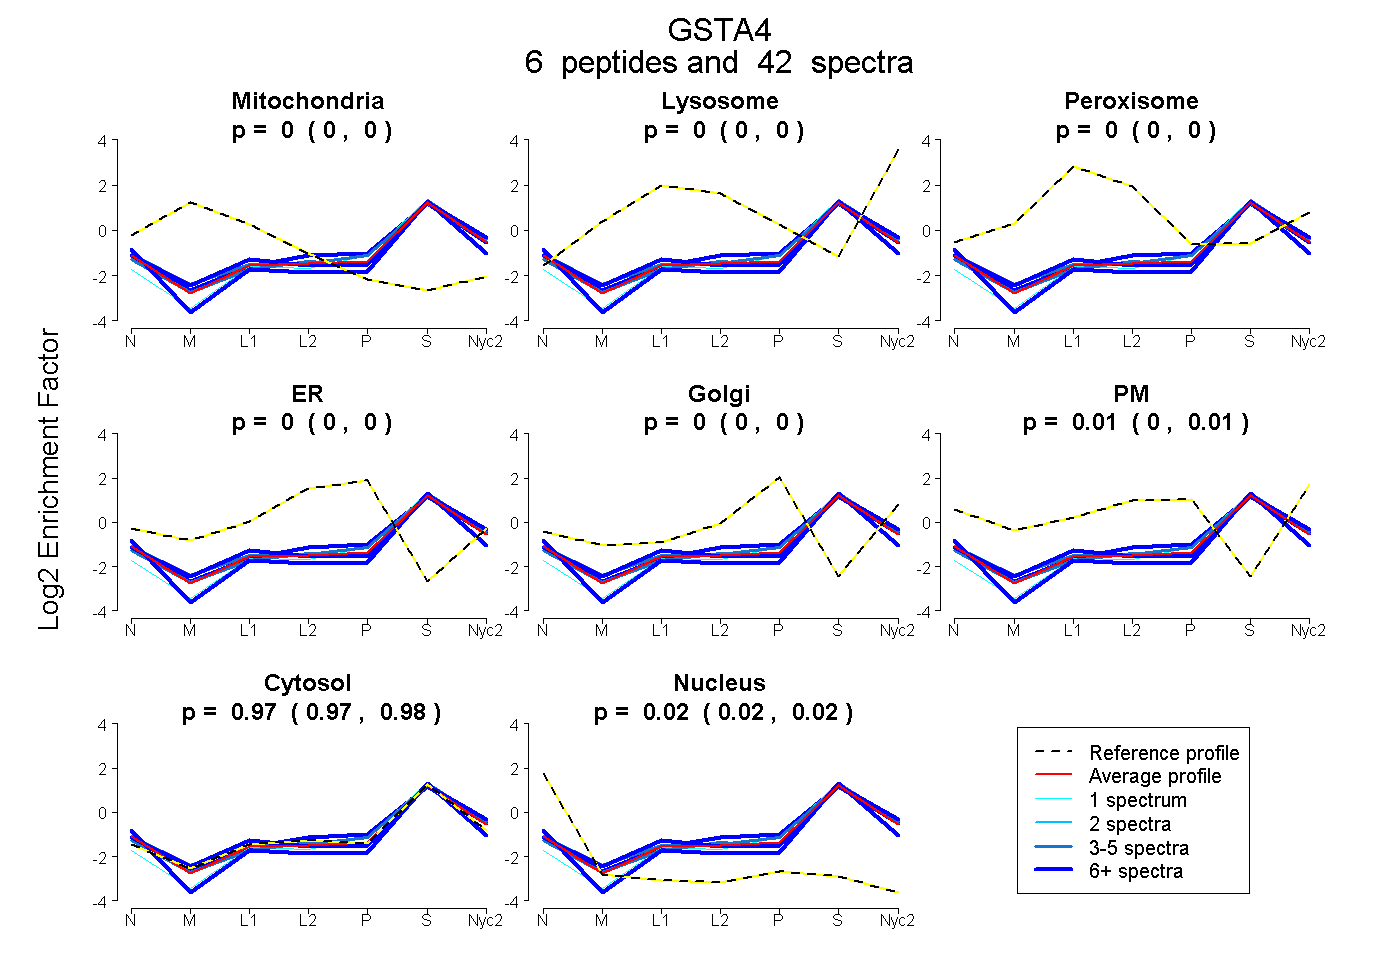
| Expt A |
6 peptides |
42 spectra |
|
0.000 0.000 | 0.000 |
0.000 0.000 | 0.000 |
0.000 0.000 | 0.000 |
0.000 0.000 | 0.000 |
0.000 0.000 | 0.000 |
0.006 0.000 | 0.011 |
0.972 0.969 | 0.975 |
0.021 0.017 | 0.025 |
| 7 spectra, YFPVFEK | 0.000 | 0.000 | 0.000 | 0.000 | 0.000 | 0.000 | 0.890 | 0.110 | ||
| 17 spectra, LYYFQGR | 0.000 | 0.045 | 0.000 | 0.000 | 0.000 | 0.000 | 0.938 | 0.017 | ||
| 3 spectra, ISNIPTIK | 0.000 | 0.000 | 0.000 | 0.000 | 0.000 | 0.000 | 1.000 | 0.000 | ||
| 1 spectrum, EESLALAVK | 0.000 | 0.000 | 0.000 | 0.000 | 0.000 | 0.000 | 1.000 | 0.000 | ||
| 5 spectra, KPPPDGHYVDVVR | 0.000 | 0.000 | 0.000 | 0.000 | 0.041 | 0.018 | 0.938 | 0.003 | ||
| 9 spectra, AILSYLAAK | 0.000 | 0.000 | 0.000 | 0.000 | 0.069 | 0.000 | 0.931 | 0.000 |
| Plot | Mito | Lyso or Perox | ER | Golgi | PM | Cytosol | Nucleus | ||||||
| Expt B |
4 peptides |
28 spectra |
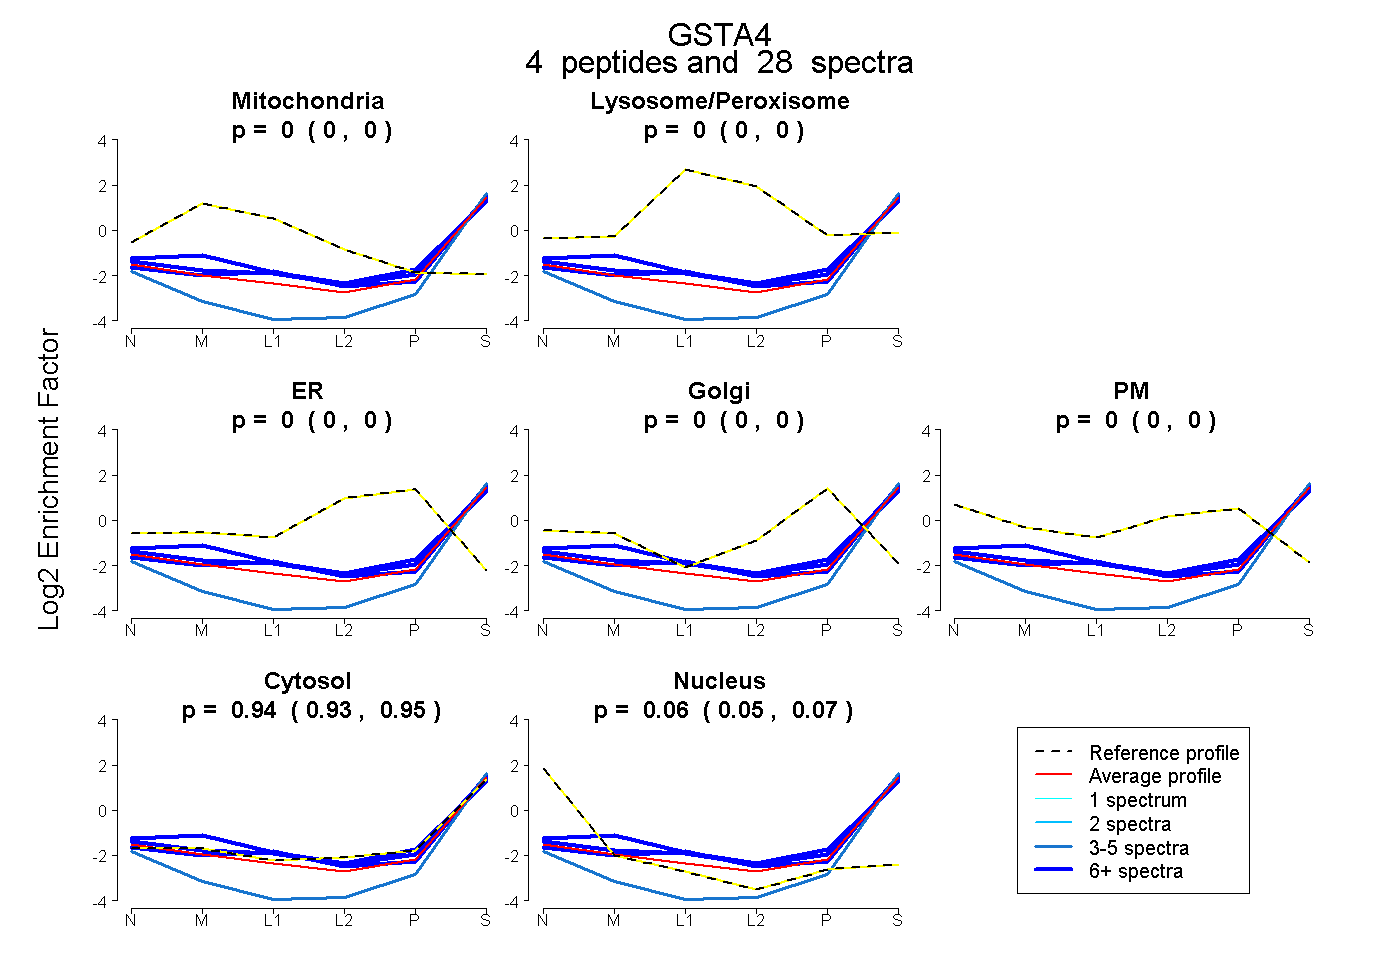 |
0.000 0.000 | 0.000 |
0.000 0.000 | 0.000 |
0.000 0.000 | 0.000 |
0.000 0.000 | 0.000 |
0.000 0.000 | 0.000 |
0.940 0.930 | 0.948 |
0.060 0.050 | 0.068 |
|||
| Plot | Lyso | Other | |||||||||||
| Expt C |
6 peptides |
78 spectra |
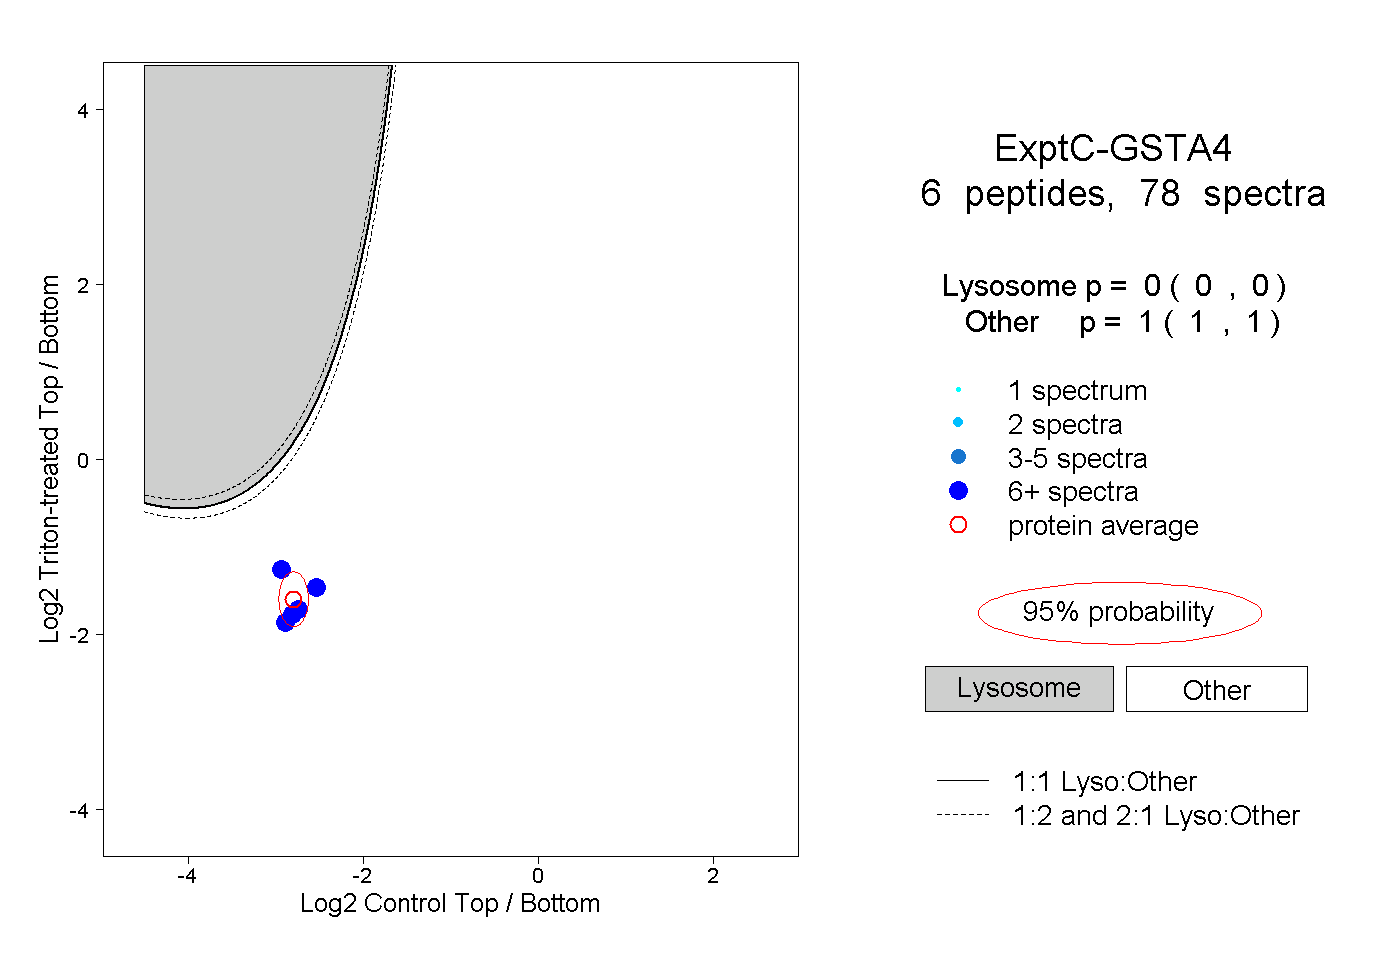 |
0.000 0.000 | 0.000 |
1.000 1.000 | 1.000 |
||||||||
| Plot | Lyso | Other | |||||||||||
| Expt D |
3 peptides |
8 spectra |
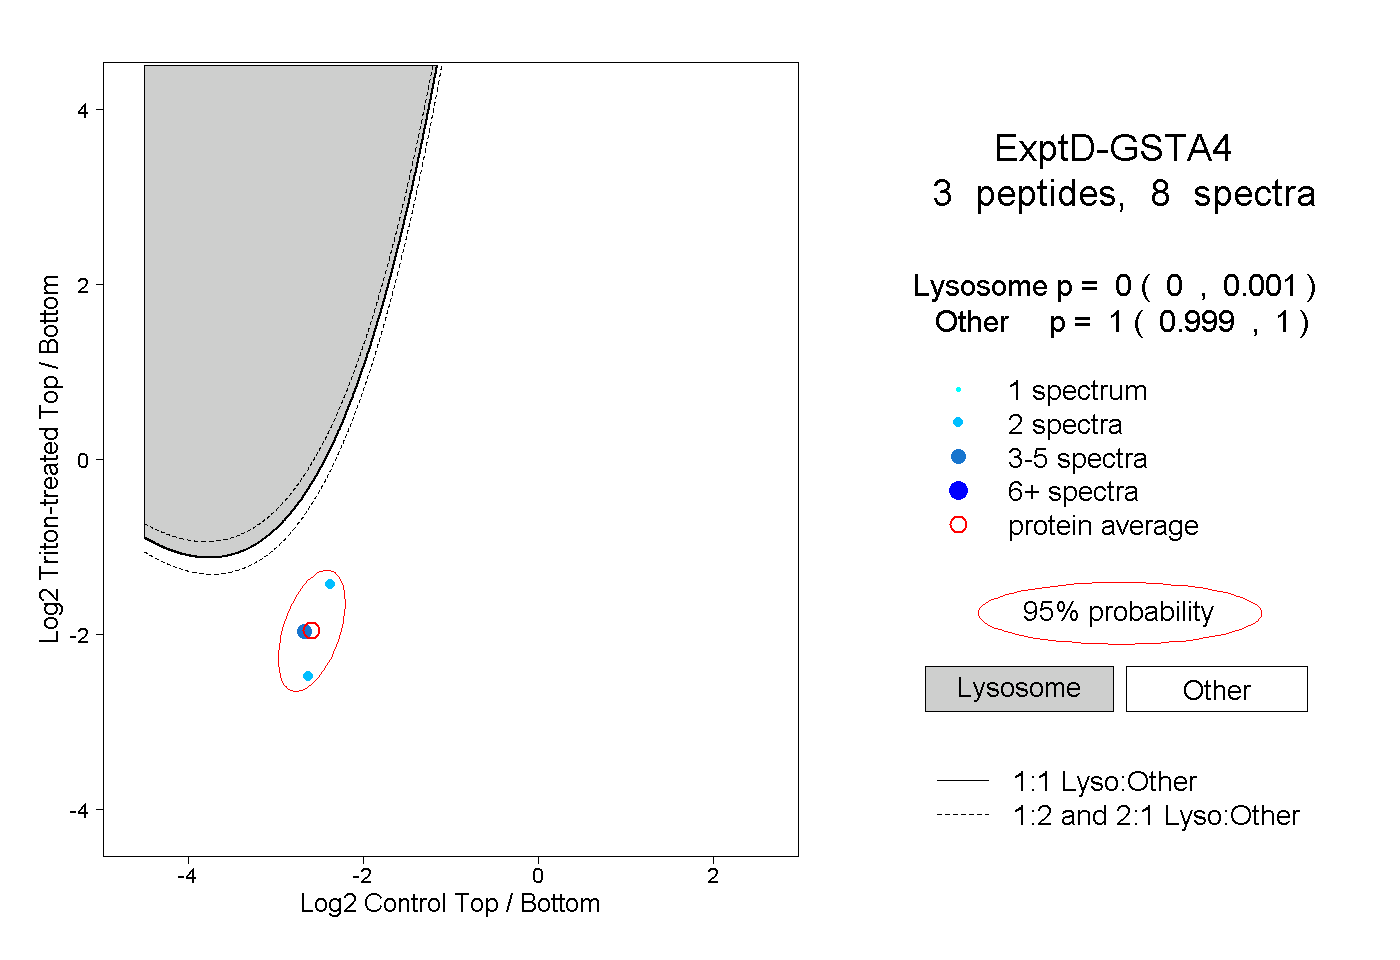 |
0.000 0.000 | 0.001 |
1.000 0.999 | 1.000 |