 4
4peptides
spectra
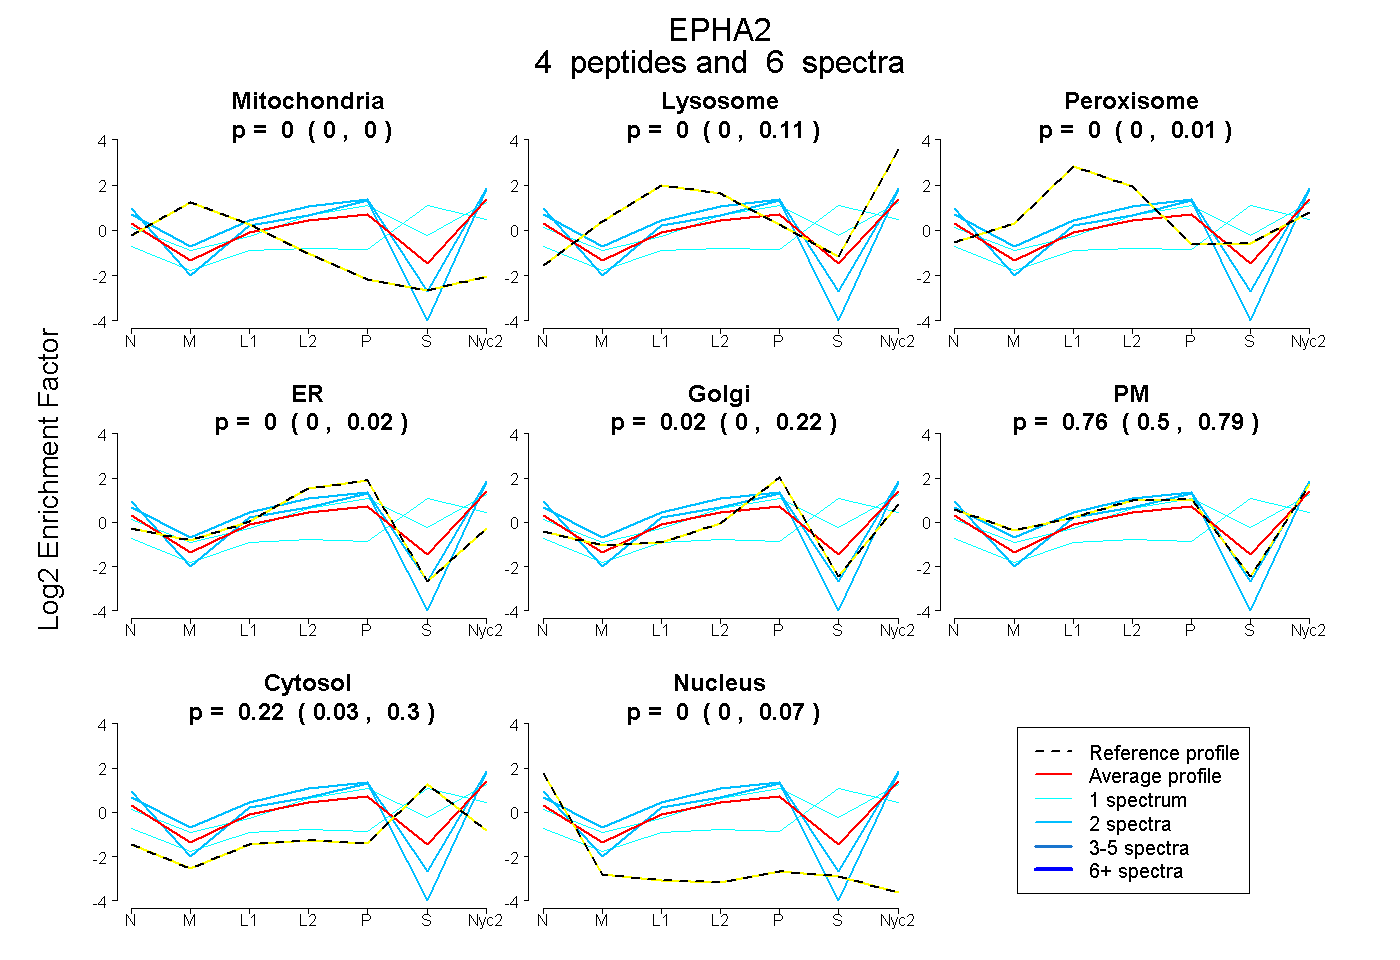
0.000 | 0.000
0.000 | 0.109
0.000 | 0.009
0.000 | 0.022
0.000 | 0.225
0.500 | 0.794
0.033 | 0.300
0.000 | 0.070
| Plot | Mito | Lyso | Perox | ER | Golgi | PM | Cytosol | Nucleus | |||||
| Expt A |
4 peptides |
6 spectra |
|
0.000 0.000 | 0.000 |
0.000 0.000 | 0.109 |
0.000 0.000 | 0.009 |
0.000 0.000 | 0.022 |
0.021 0.000 | 0.225 |
0.756 0.500 | 0.794 |
0.223 0.033 | 0.300 |
0.000 0.000 | 0.070 |
| 2 spectra, LPSTSGSEGVPFR | 0.000 | 0.000 | 0.000 | 0.011 | 0.000 | 0.989 | 0.000 | 0.000 | ||
| 2 spectra, VLEDDPEATYTTSGGK | 0.000 | 0.000 | 0.000 | 0.000 | 0.132 | 0.821 | 0.000 | 0.047 | ||
| 1 spectrum, IAYSLLGLK | 0.000 | 0.119 | 0.000 | 0.000 | 0.079 | 0.515 | 0.287 | 0.000 | ||
| 1 spectrum, TVSEWLESIK | 0.000 | 0.155 | 0.000 | 0.000 | 0.000 | 0.087 | 0.758 | 0.000 |
| Plot | Lyso | Other | |||||||||||
| Expt C |
5 peptides |
14 spectra |
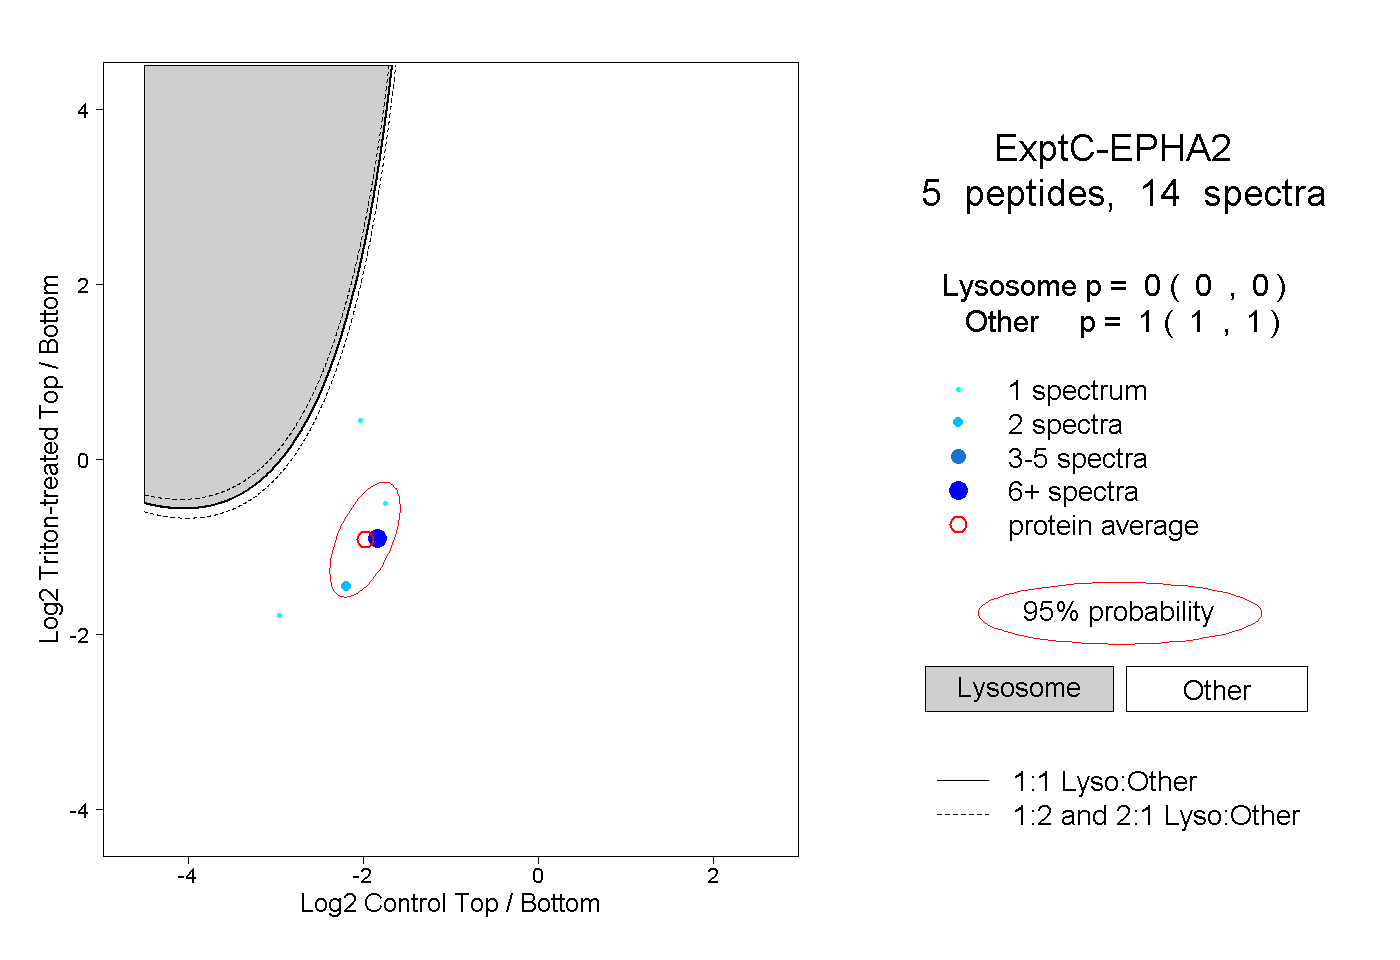 |
0.000 0.000 | 0.000 |
1.000 1.000 | 1.000 |