 4
4peptides
spectra
0.000 | 0.000
0.000 | 0.000
0.324 | 0.386
0.047 | 0.102
0.000 | 0.000
0.000 | 0.000
0.134 | 0.204
0.370 | 0.413
3peptides
spectra
0.000 | 0.000
1.000 | 1.000
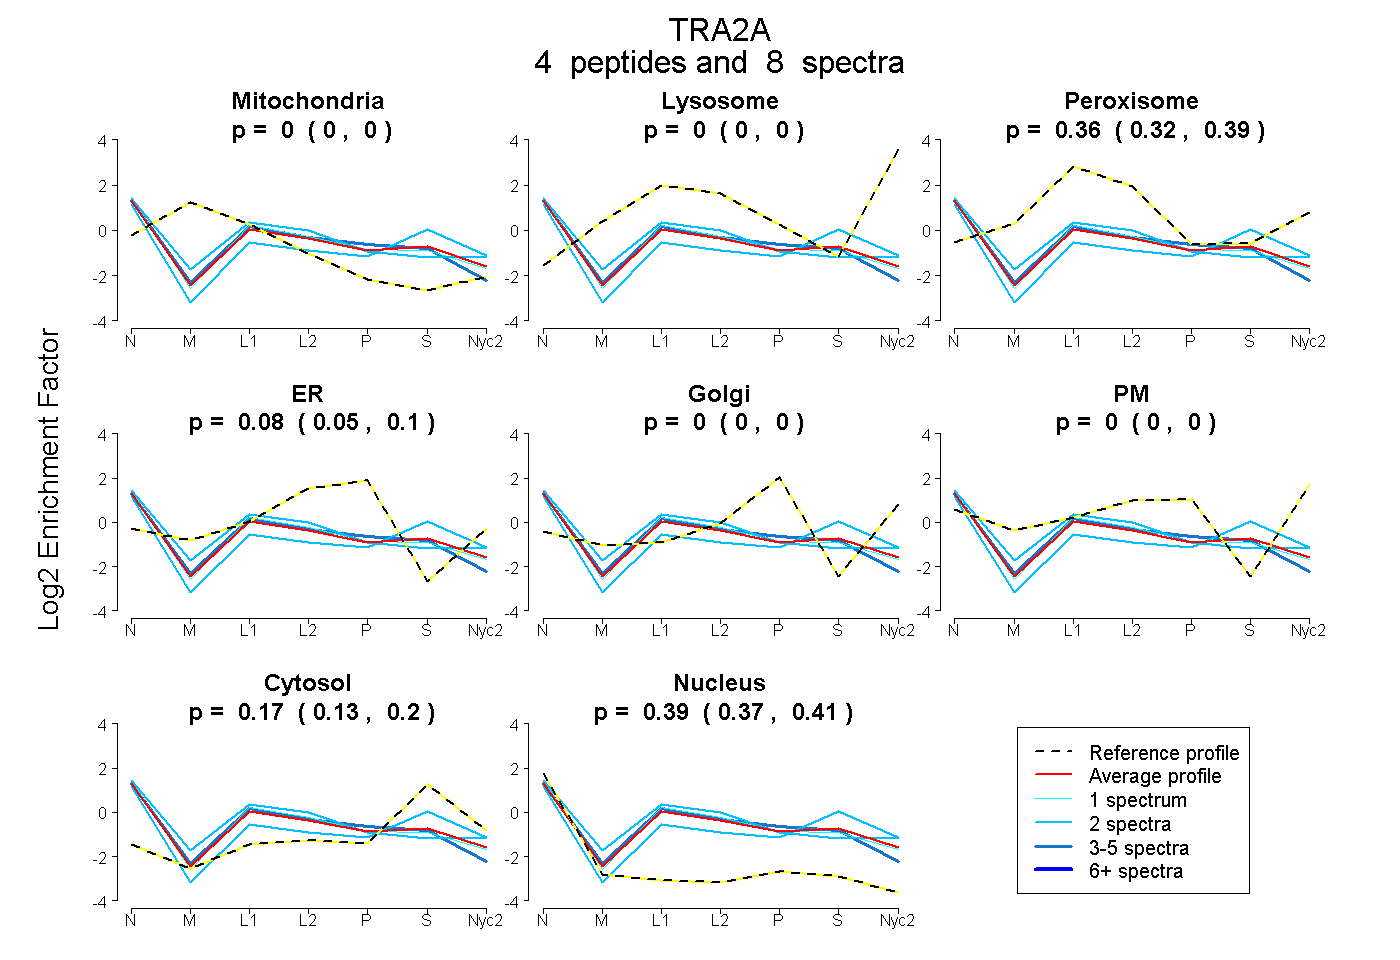
| Plot | Mito | Lyso | Perox | ER | Golgi | PM | Cytosol | Nucleus | |||||
| Expt A |
4 peptides |
8 spectra |
|
0.000 0.000 | 0.000 |
0.000 0.000 | 0.000 |
0.359 0.324 | 0.386 |
0.078 0.047 | 0.102 |
0.000 0.000 | 0.000 |
0.000 0.000 | 0.000 |
0.171 0.134 | 0.204 |
0.393 0.370 | 0.413 |
||
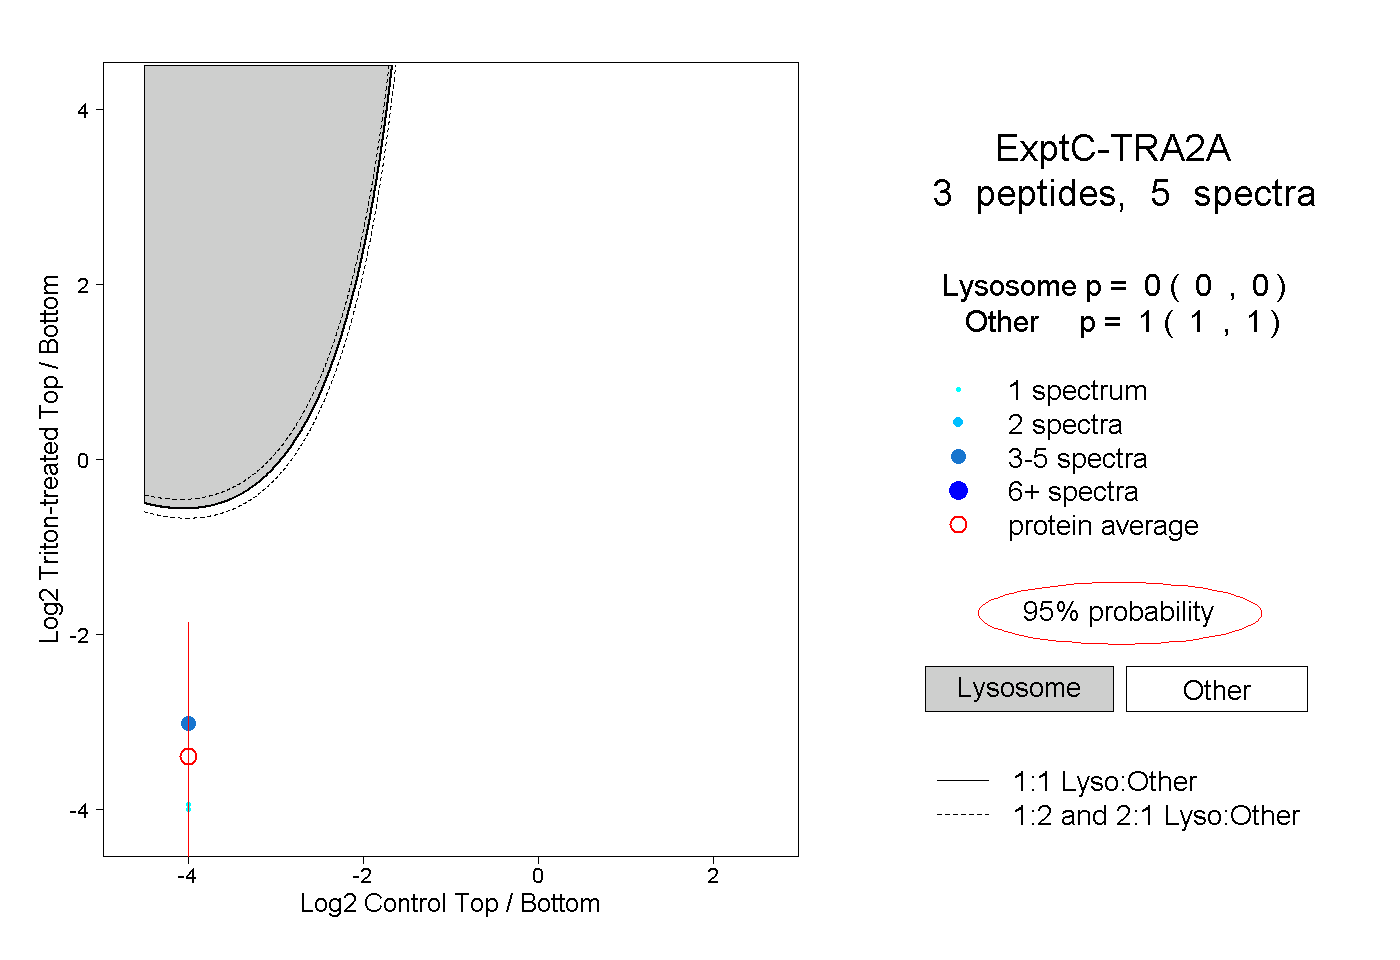
| Plot | Lyso | Other | |||||||||||
| Expt C |
3 peptides |
5 spectra |
|
0.000 0.000 | 0.000 |
1.000 1.000 | 1.000 |