 2
2peptides
spectra
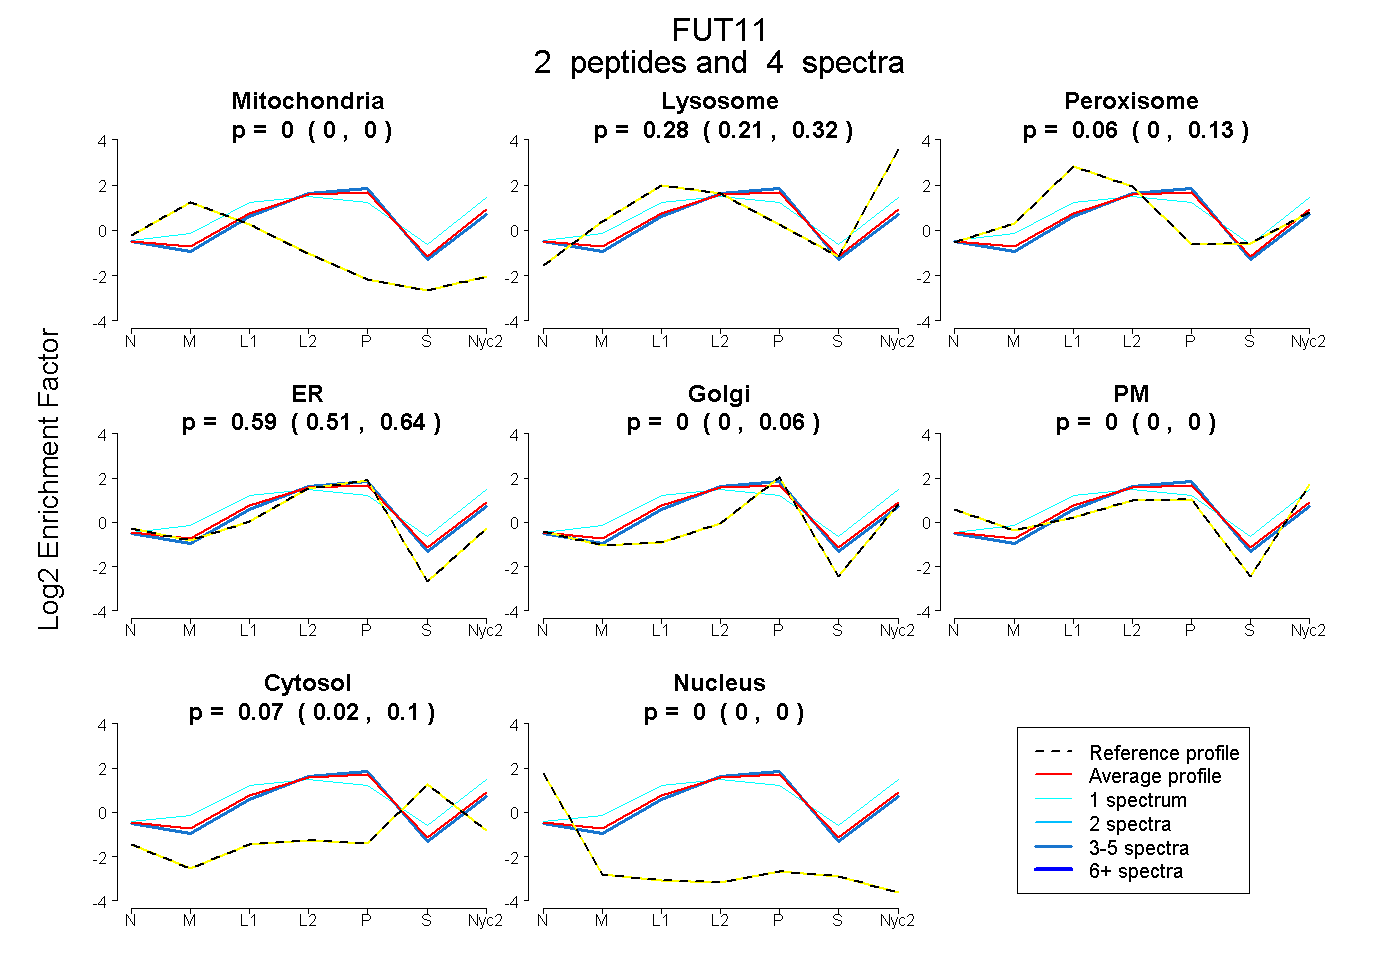
0.000 | 0.000
0.214 | 0.324
0.000 | 0.135
0.506 | 0.637
0.000 | 0.057
0.000 | 0.000
0.020 | 0.104
0.000 | 0.000
| Plot | Mito | Lyso | Perox | ER | Golgi | PM | Cytosol | Nucleus | |||||
| Expt A |
2 peptides |
4 spectra |
|
0.000 0.000 | 0.000 |
0.278 0.214 | 0.324 |
0.064 0.000 | 0.135 |
0.588 0.506 | 0.637 |
0.000 0.000 | 0.057 |
0.000 0.000 | 0.000 |
0.071 0.020 | 0.104 |
0.000 0.000 | 0.000 |
| 1 spectrum, AADAPLPR | 0.000 | 0.271 | 0.349 | 0.120 | 0.247 | 0.000 | 0.013 | 0.000 | ||
| 3 spectra, RPAPPLR | 0.000 | 0.243 | 0.018 | 0.668 | 0.000 | 0.000 | 0.071 | 0.000 |
| Plot | Lyso | Other | |||||||||||
| Expt C |
4 peptides |
11 spectra |
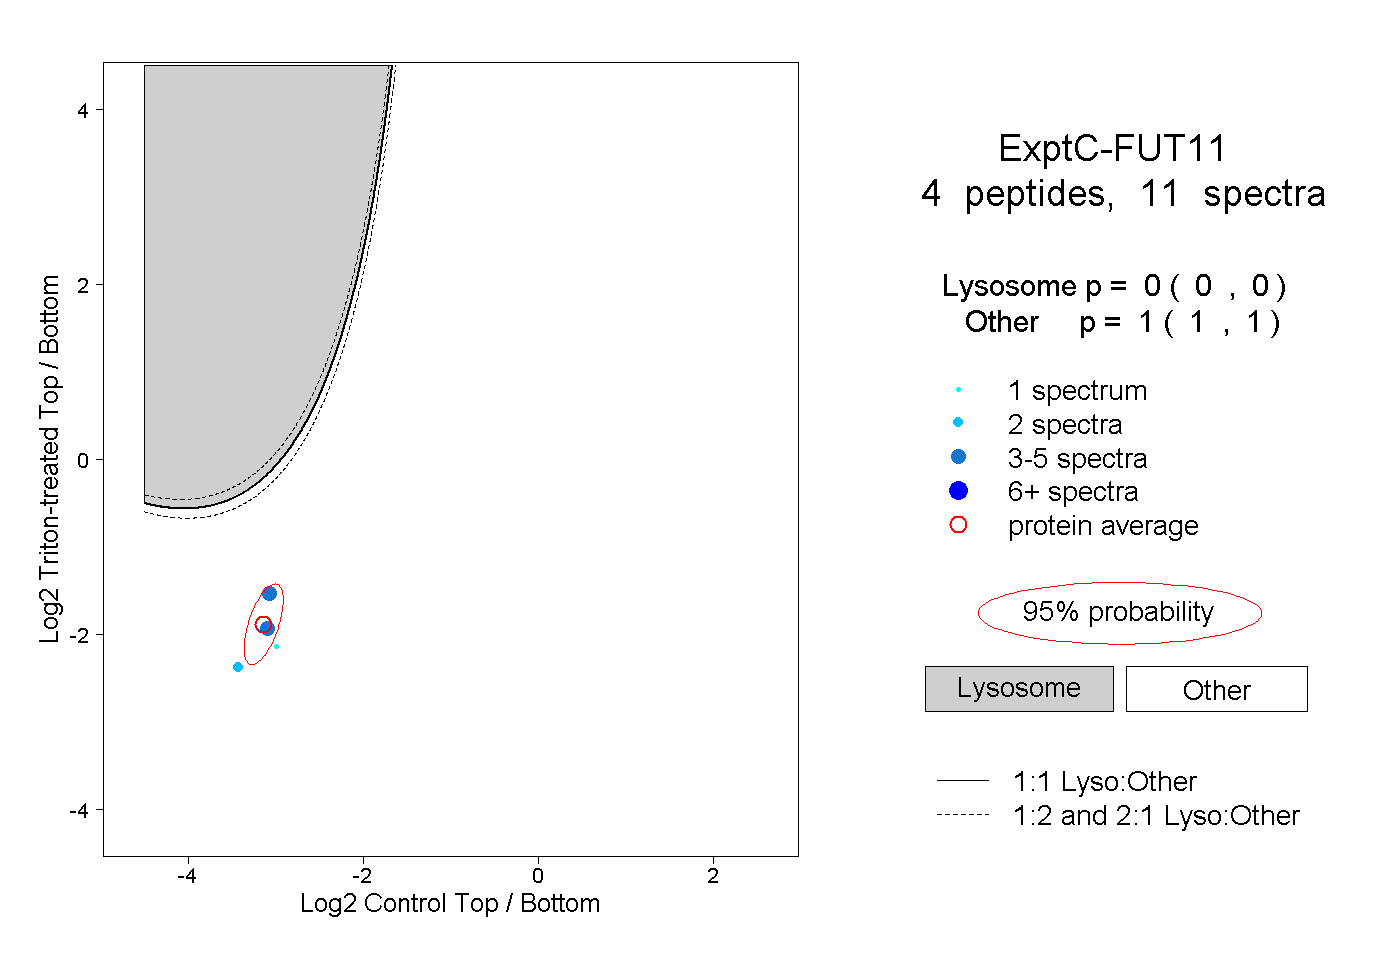 |
0.000 0.000 | 0.000 |
1.000 1.000 | 1.000 |