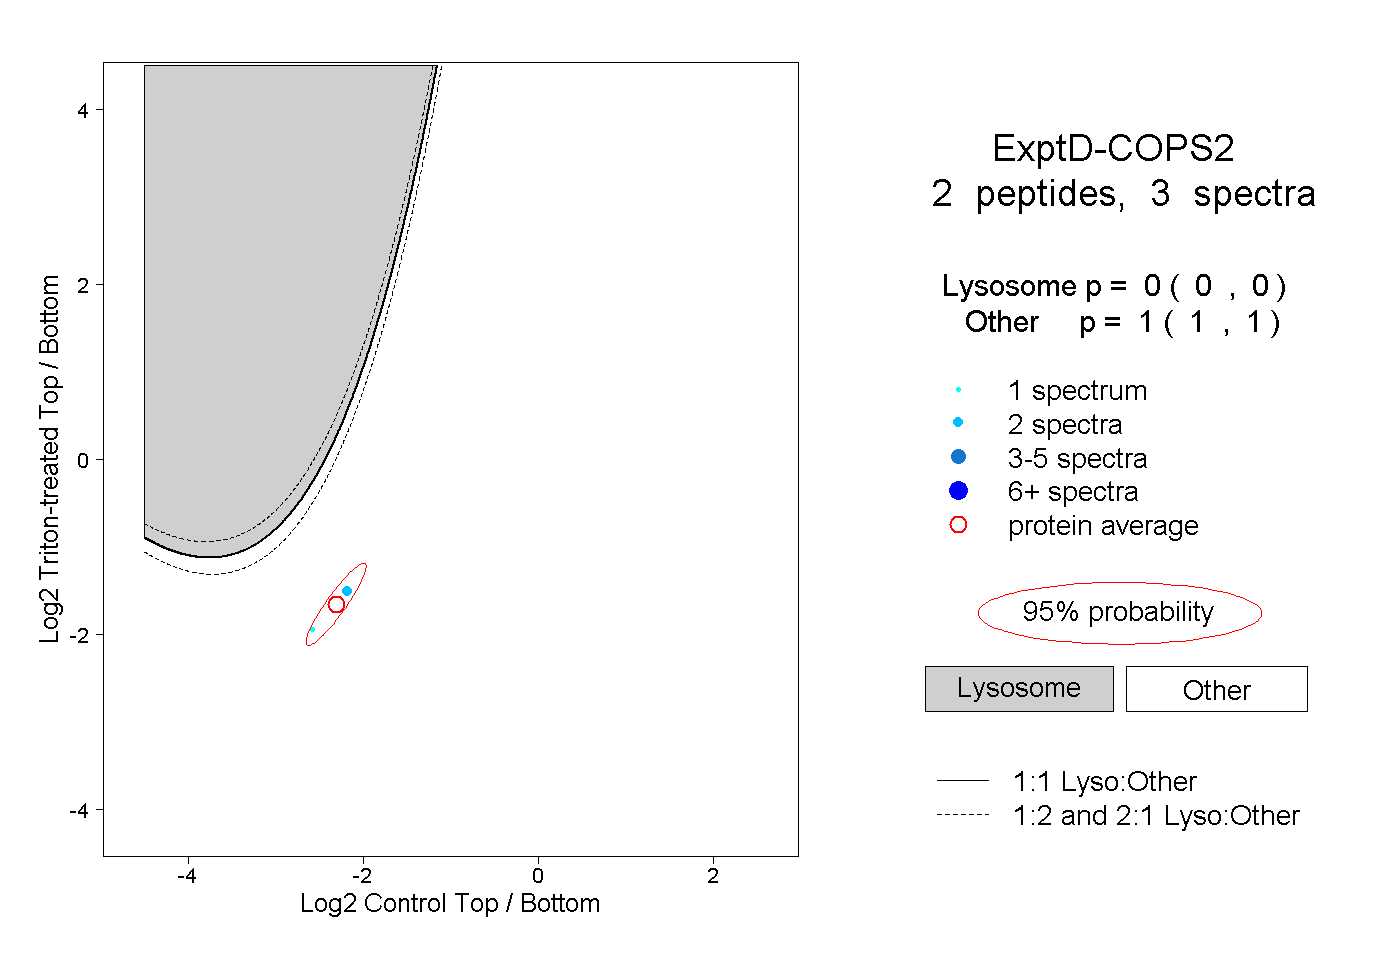
14
14peptides
spectra
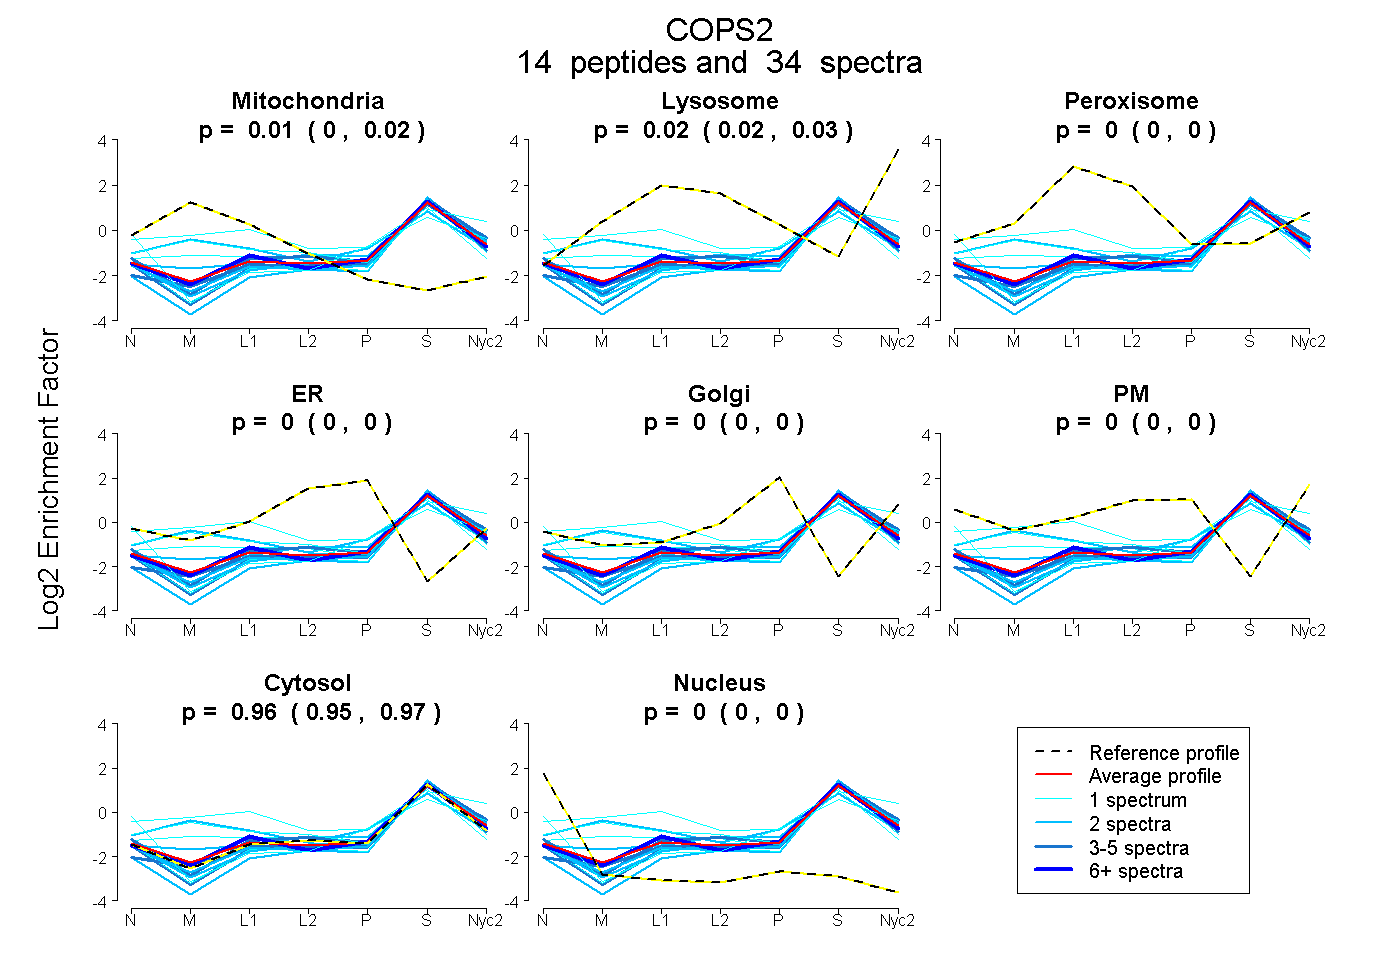
0.004 | 0.023
0.019 | 0.027
0.000 | 0.000
0.000 | 0.000
0.000 | 0.000
0.000 | 0.000
0.950 | 0.971
0.000 | 0.000
4peptides
spectra
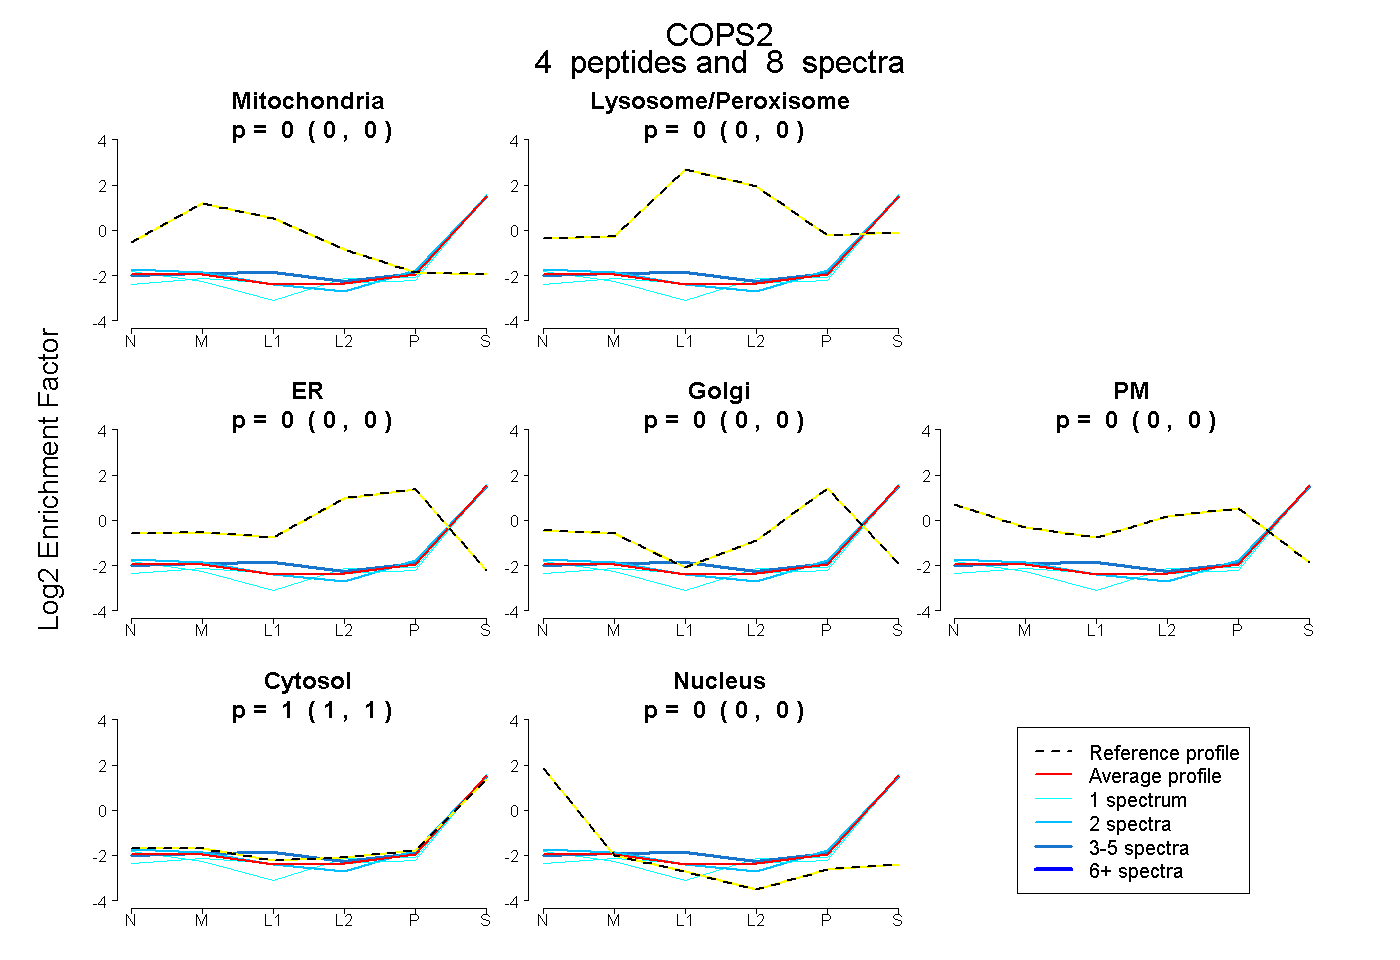
0.000 | 0.000
0.000 | 0.000
0.000 | 0.000
0.000 | 0.000
0.000 | 0.000
1.000 | 1.000
0.000 | 0.000
9peptides
spectra
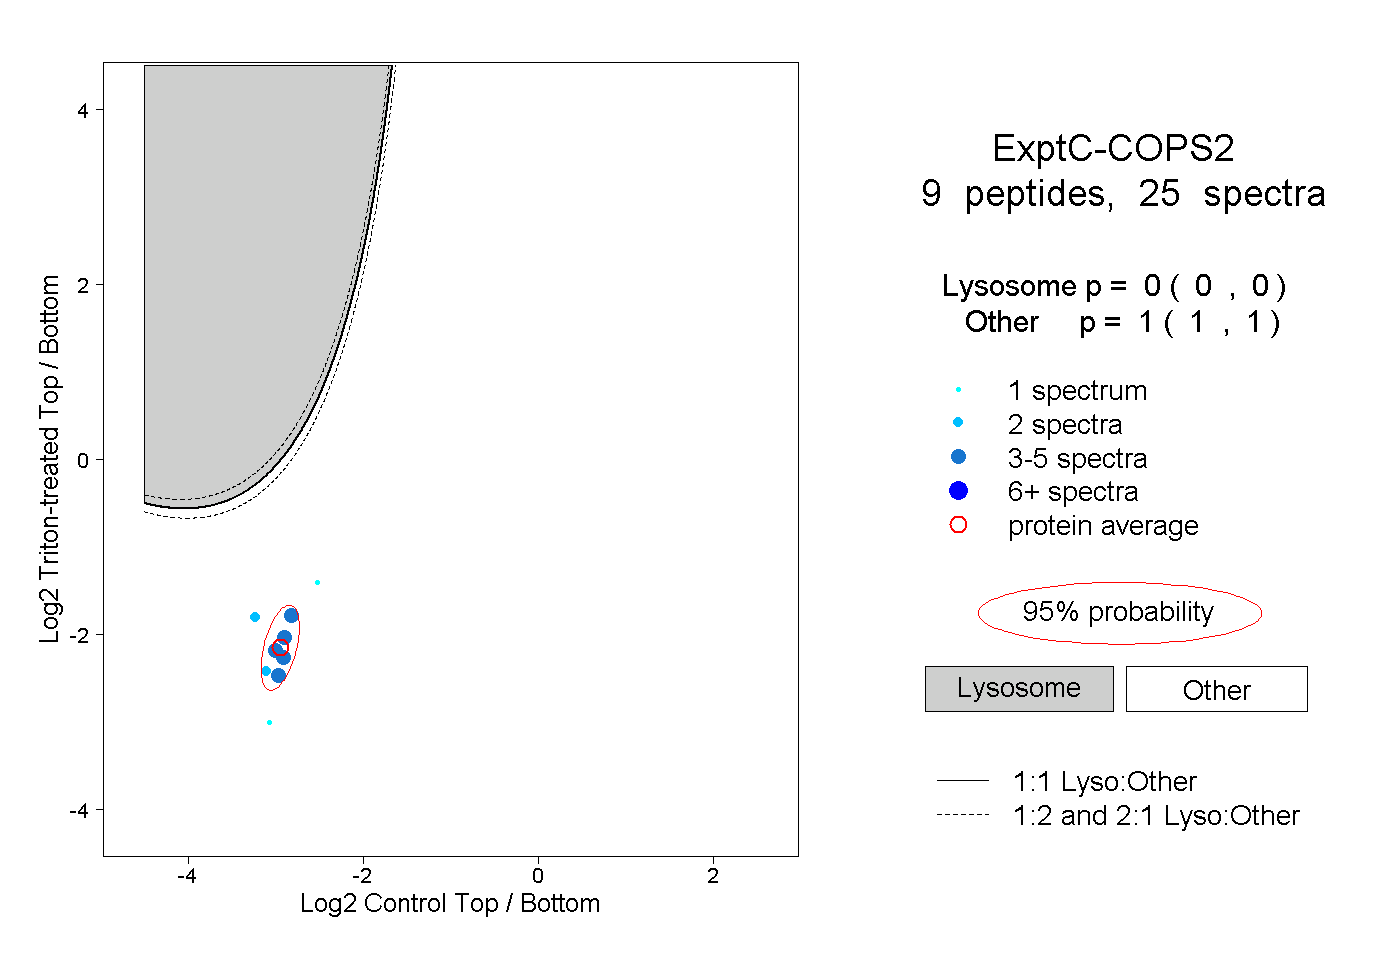
0.000 | 0.000
1.000 | 1.000