 14
14peptides
spectra
0.004 | 0.023
0.019 | 0.027
0.000 | 0.000
0.000 | 0.000
0.000 | 0.000
0.000 | 0.000
0.950 | 0.971
0.000 | 0.000
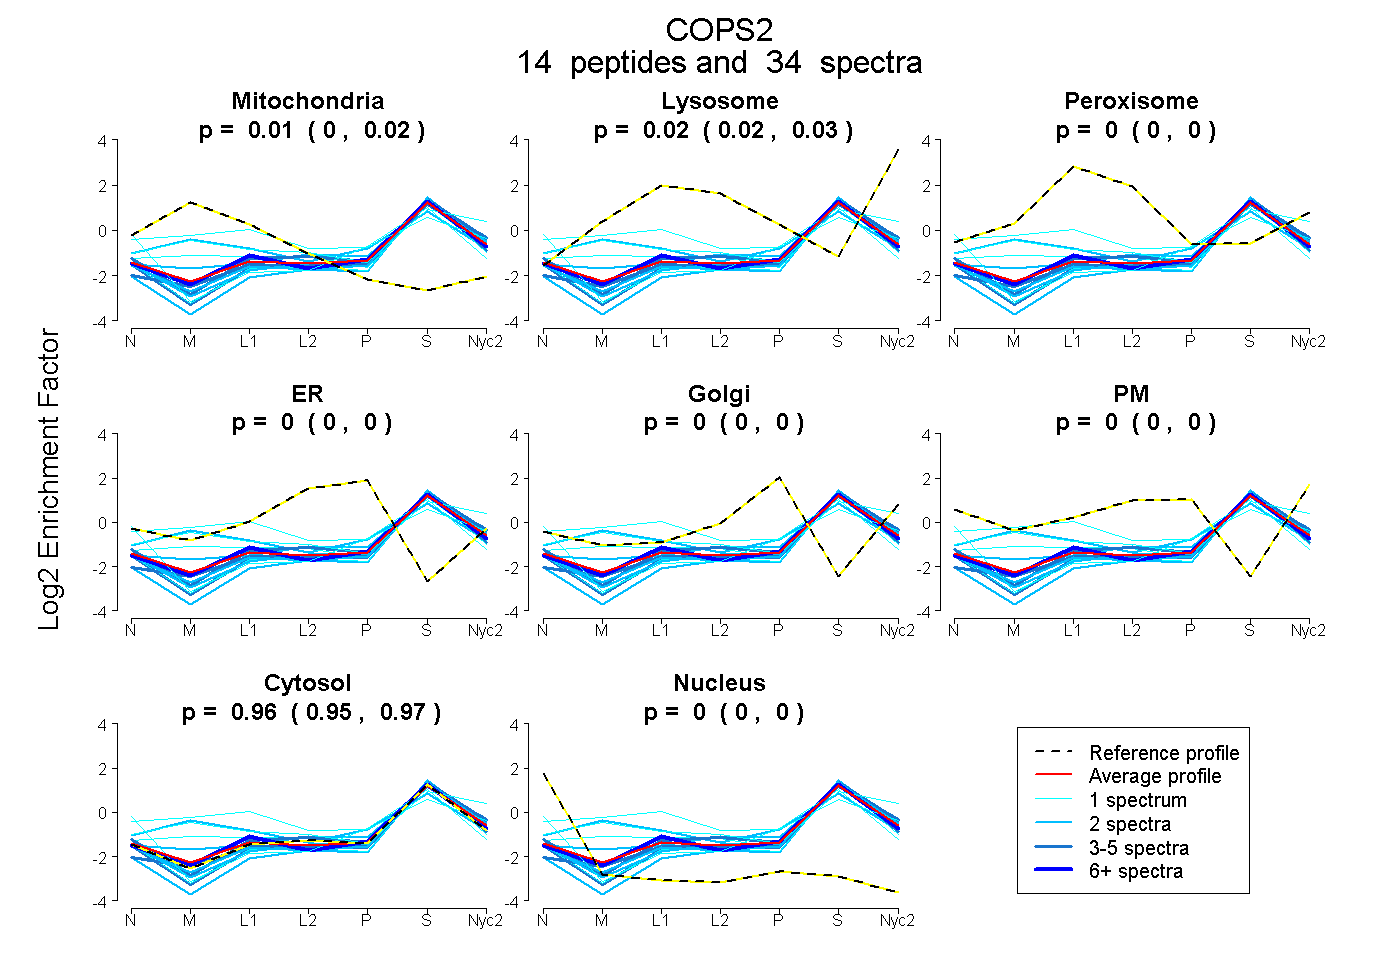
| Plot | Mito | Lyso | Perox | ER | Golgi | PM | Cytosol | Nucleus | |||||
| Expt A |
14 peptides |
34 spectra |
|
0.015 0.004 | 0.023 |
0.023 0.019 | 0.027 |
0.000 0.000 | 0.000 |
0.000 0.000 | 0.000 |
0.000 0.000 | 0.000 |
0.000 0.000 | 0.000 |
0.962 0.950 | 0.971 |
0.000 0.000 | 0.000 |
| 9 spectra, SAIPHPLIMGVIR | 0.012 | 0.013 | 0.000 | 0.000 | 0.000 | 0.000 | 0.975 | 0.000 | ||
| 3 spectra, LTNFPEMMNR | 0.000 | 0.009 | 0.000 | 0.000 | 0.000 | 0.000 | 0.991 | 0.000 | ||
| 2 spectra, EHIEELLR | 0.000 | 0.000 | 0.000 | 0.000 | 0.000 | 0.000 | 1.000 | 0.000 | ||
| 1 spectrum, AHTDFFEAFK | 0.162 | 0.019 | 0.024 | 0.000 | 0.000 | 0.000 | 0.794 | 0.000 | ||
| 2 spectra, QLLTYIR | 0.000 | 0.000 | 0.000 | 0.000 | 0.000 | 0.000 | 1.000 | 0.000 | ||
| 4 spectra, IHIPFISK | 0.000 | 0.038 | 0.000 | 0.000 | 0.000 | 0.010 | 0.952 | 0.000 | ||
| 1 spectrum, SINSILDYISTSK | 0.000 | 0.000 | 0.000 | 0.000 | 0.033 | 0.000 | 0.810 | 0.157 | ||
| 2 spectra, AALSSFQK | 0.246 | 0.087 | 0.000 | 0.000 | 0.009 | 0.000 | 0.658 | 0.000 | ||
| 3 spectra, EGEFEK | 0.000 | 0.000 | 0.000 | 0.000 | 0.000 | 0.000 | 0.986 | 0.014 | ||
| 2 spectra, GEWGFK | 0.030 | 0.075 | 0.000 | 0.000 | 0.000 | 0.000 | 0.895 | 0.000 | ||
| 1 spectrum, LIKPYTR | 0.000 | 0.000 | 0.000 | 0.000 | 0.000 | 0.000 | 0.965 | 0.035 | ||
| 1 spectrum, TNHSNIMDDPFIR | 0.186 | 0.018 | 0.242 | 0.000 | 0.000 | 0.051 | 0.503 | 0.000 | ||
| 2 spectra, NYDESGSPR | 0.000 | 0.000 | 0.000 | 0.000 | 0.000 | 0.000 | 1.000 | 0.000 | ||
| 1 spectrum, TQVLIK | 0.134 | 0.217 | 0.000 | 0.000 | 0.000 | 0.000 | 0.650 | 0.000 |
| Plot | Mito | Lyso or Perox | ER | Golgi | PM | Cytosol | Nucleus | ||||||
| Expt B |
4 peptides |
8 spectra |
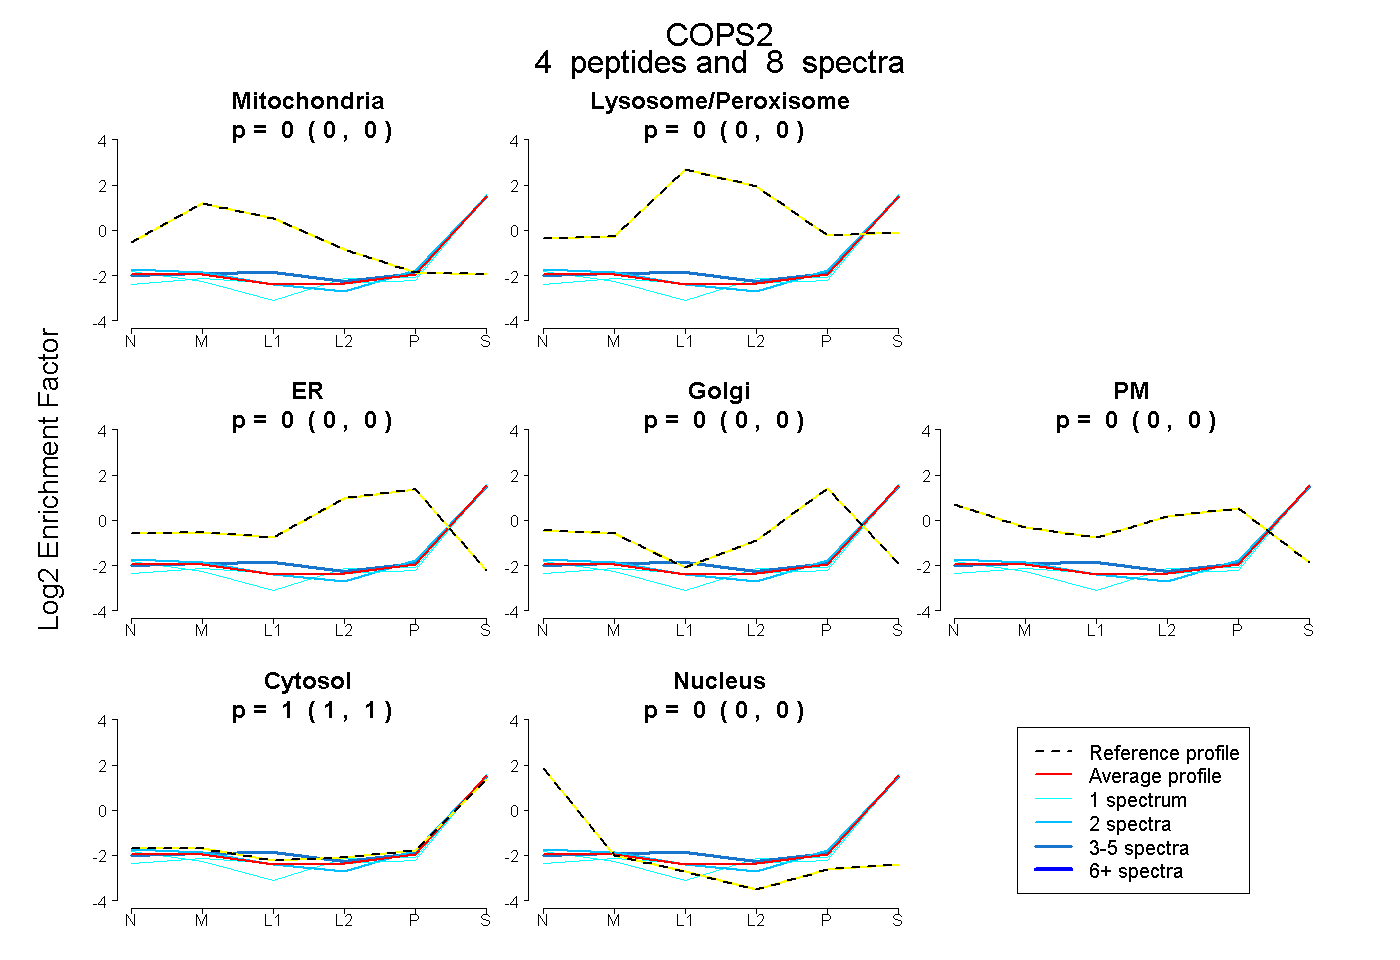 |
0.000 0.000 | 0.000 |
0.000 0.000 | 0.000 |
0.000 0.000 | 0.000 |
0.000 0.000 | 0.000 |
0.000 0.000 | 0.000 |
1.000 1.000 | 1.000 |
0.000 0.000 | 0.000 |
|||
| Plot | Lyso | Other | |||||||||||
| Expt C |
9 peptides |
25 spectra |
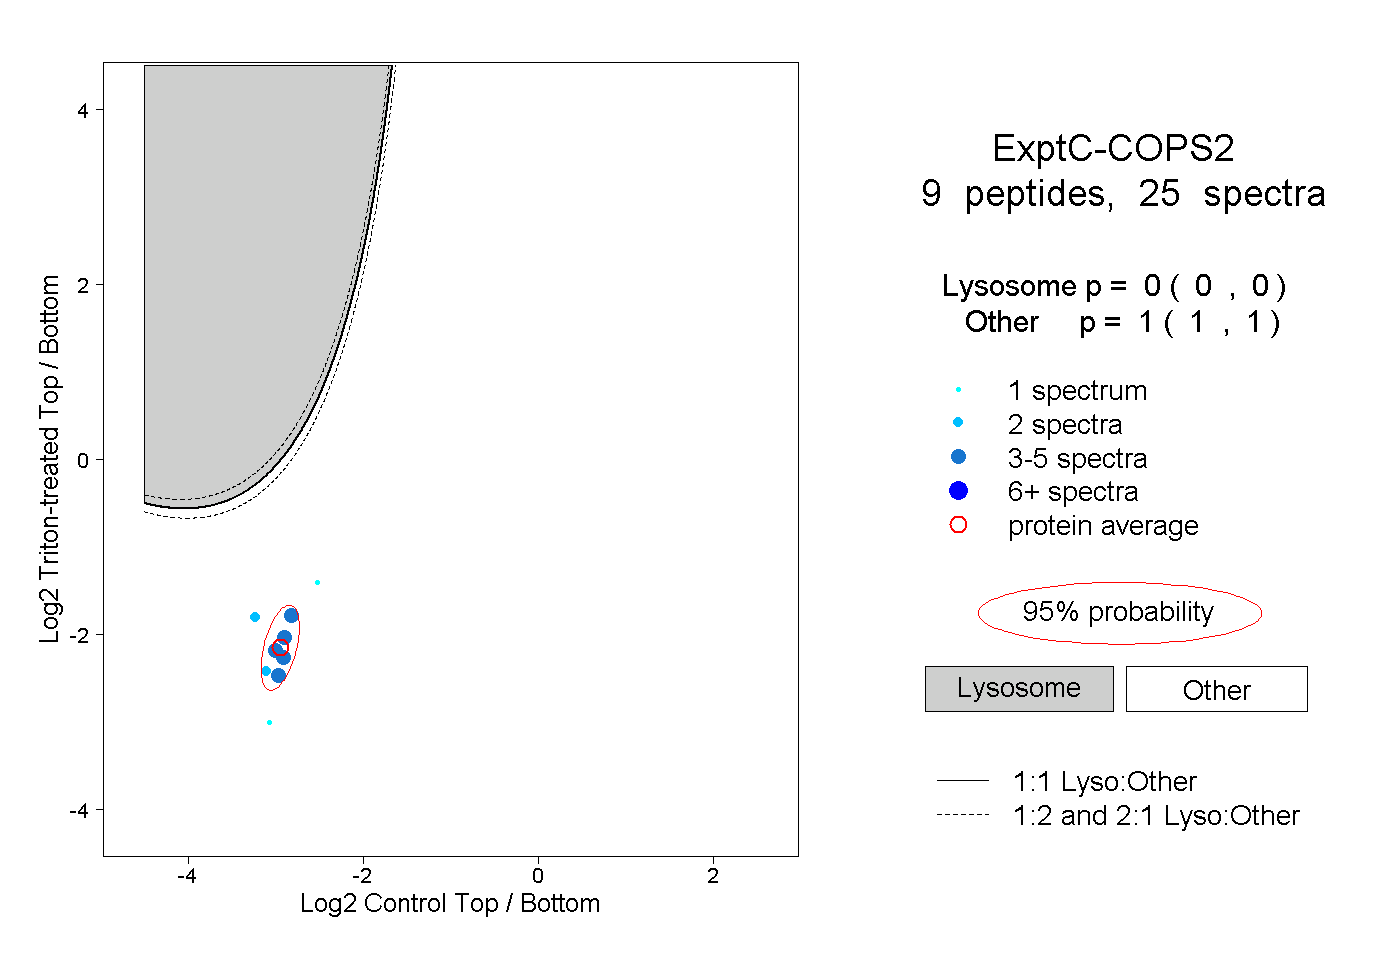 |
0.000 0.000 | 0.000 |
1.000 1.000 | 1.000 |
||||||||
| Plot | Lyso | Other | |||||||||||
| Expt D |
2 peptides |
3 spectra |
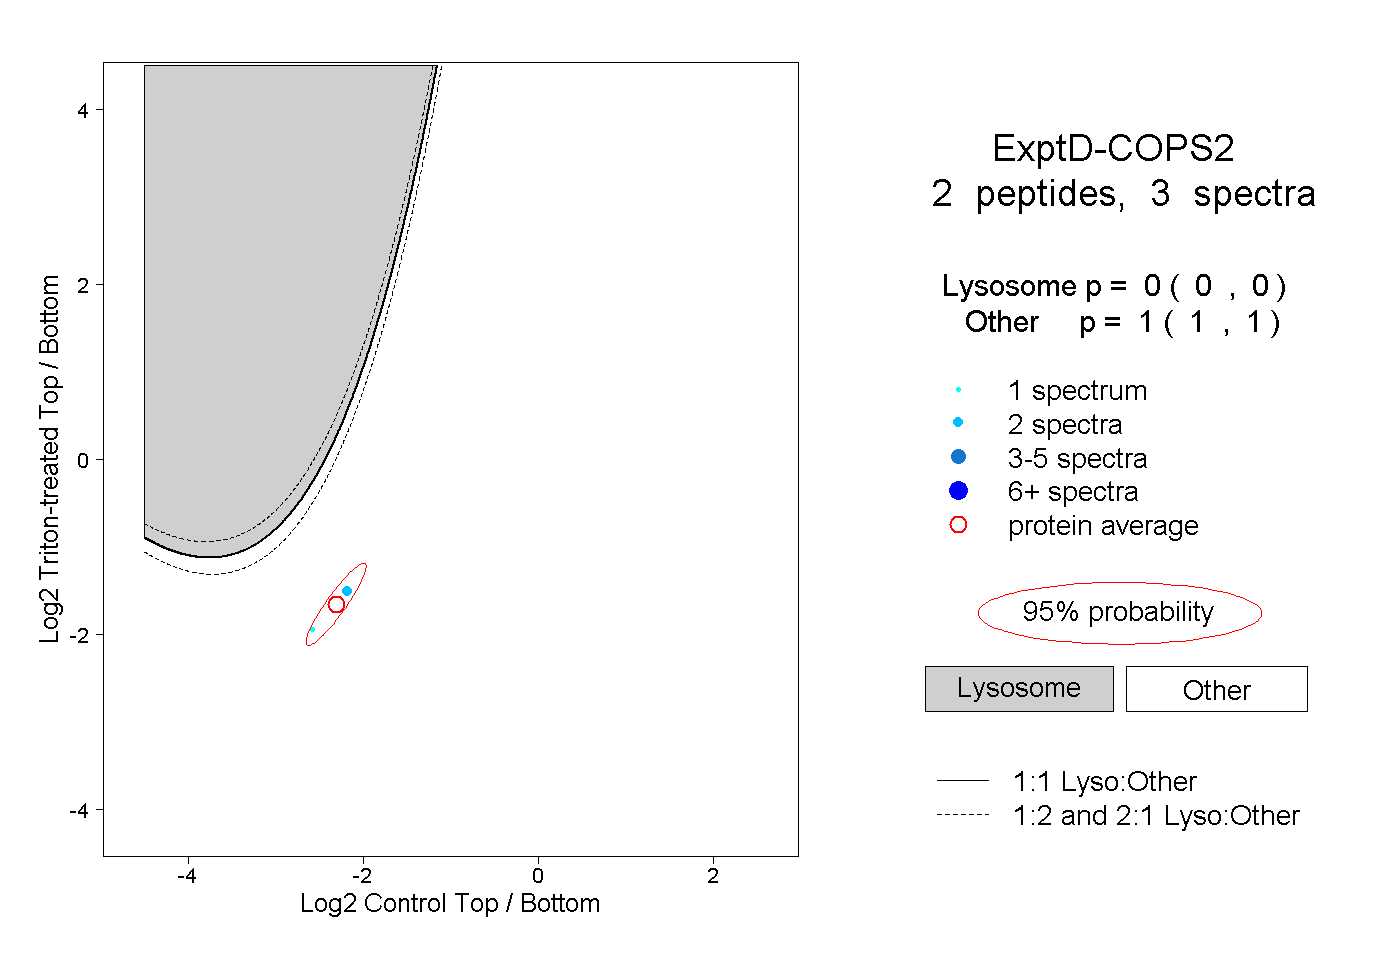 |
0.000 0.000 | 0.000 |
1.000 1.000 | 1.000 |