 3
3peptides
spectra
0.000 | 0.062
0.000 | 0.196
0.000 | 0.000
0.000 | 0.000
0.433 | 0.844
0.000 | 0.371
0.000 | 0.107
0.000 | 0.079
| Plot | Mito | Lyso | Perox | ER | Golgi | PM | Cytosol | Nucleus | |||||
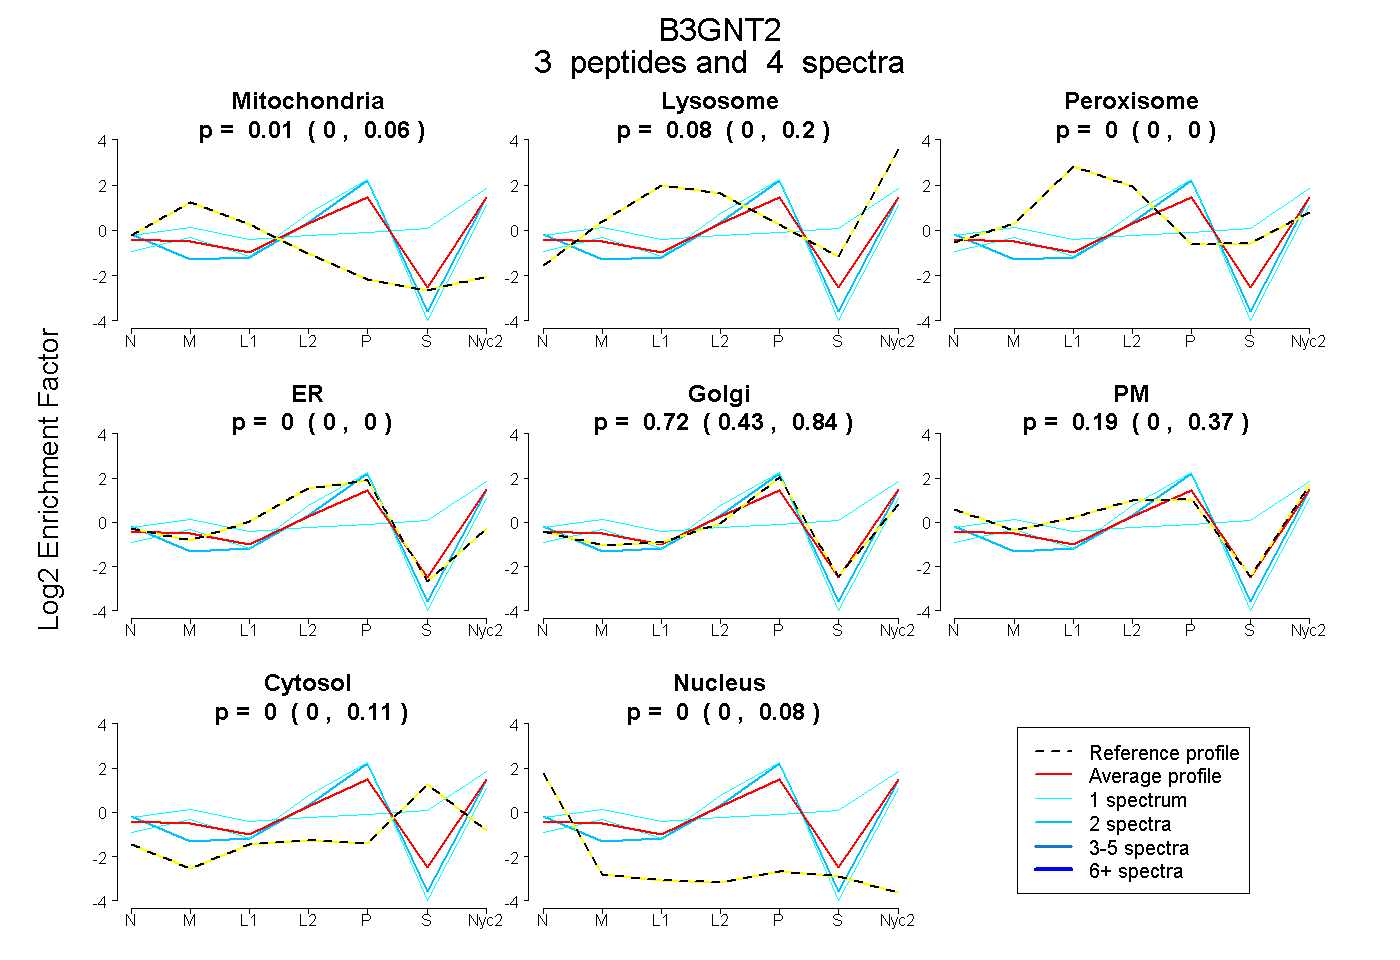
| Expt A |
3 peptides |
4 spectra |
|
0.008 0.000 | 0.062 |
0.082 0.000 | 0.196 |
0.000 0.000 | 0.000 |
0.000 0.000 | 0.000 |
0.721 0.433 | 0.844 |
0.186 0.000 | 0.371 |
0.000 0.000 | 0.107 |
0.004 0.000 | 0.079 |
| 1 spectrum, VFLLGK | 0.000 | 0.000 | 0.000 | 0.233 | 0.752 | 0.015 | 0.000 | 0.000 | ||
| 1 spectrum, LSSLPR | 0.012 | 0.327 | 0.000 | 0.000 | 0.000 | 0.291 | 0.370 | 0.000 | ||
| 2 spectra, EVLFLR | 0.000 | 0.000 | 0.000 | 0.000 | 0.901 | 0.099 | 0.000 | 0.000 |
| Plot | Mito | Lyso or Perox | ER | Golgi | PM | Cytosol | Nucleus | ||||||
| Expt B |
1 peptide |
1 spectrum |
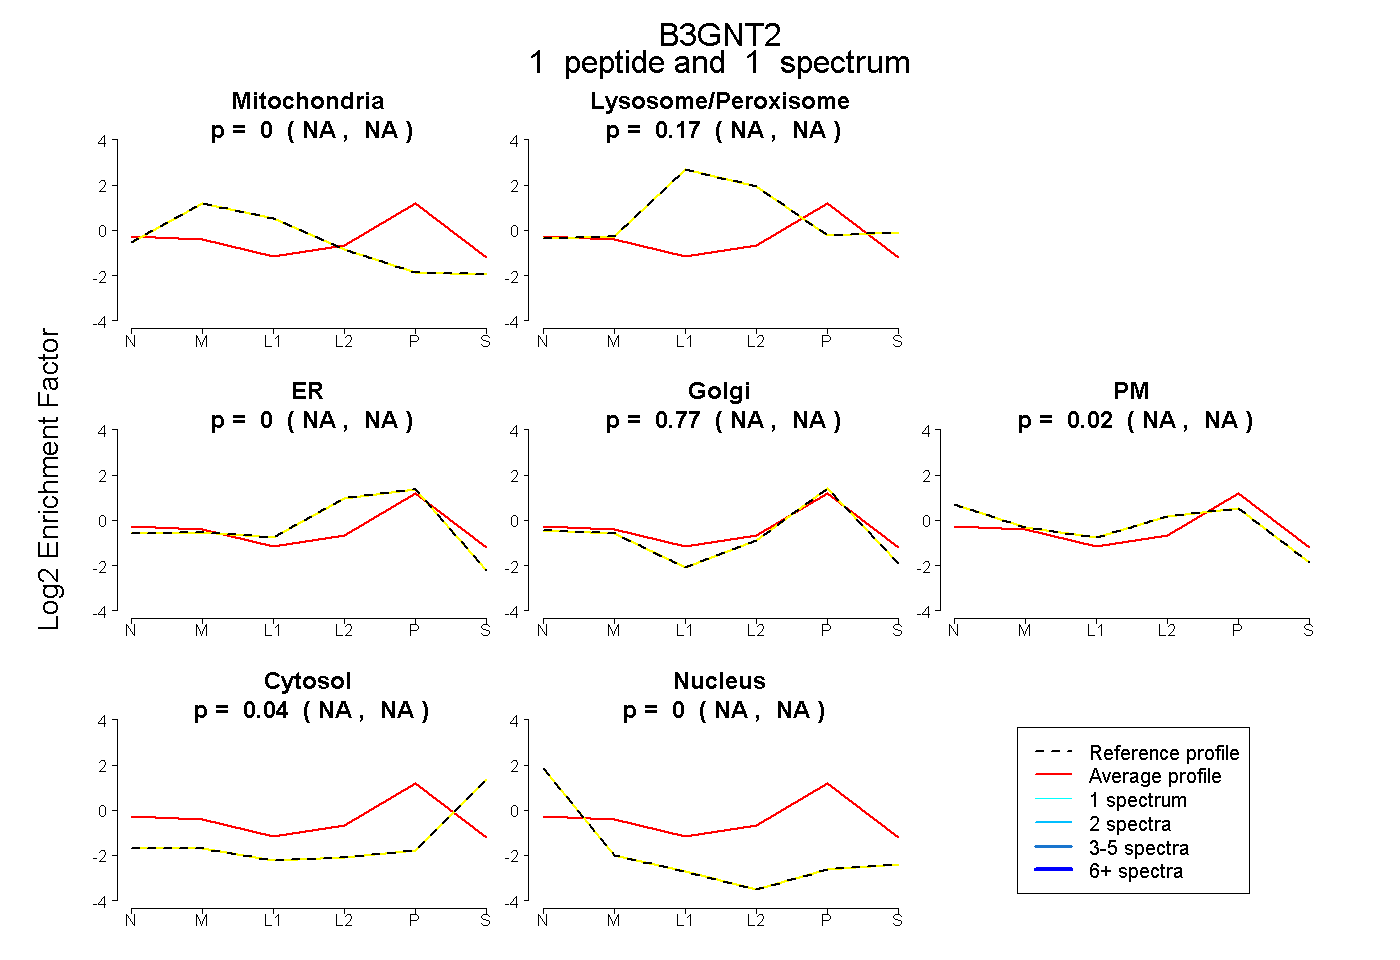 |
0.000 NA | NA |
0.170 NA | NA |
0.000 NA | NA |
0.773 NA | NA |
0.016 NA | NA |
0.041 NA | NA |
0.000 NA | NA |
|||
| Plot | Lyso | Other | |||||||||||
| Expt C |
1 peptide |
1 spectrum |
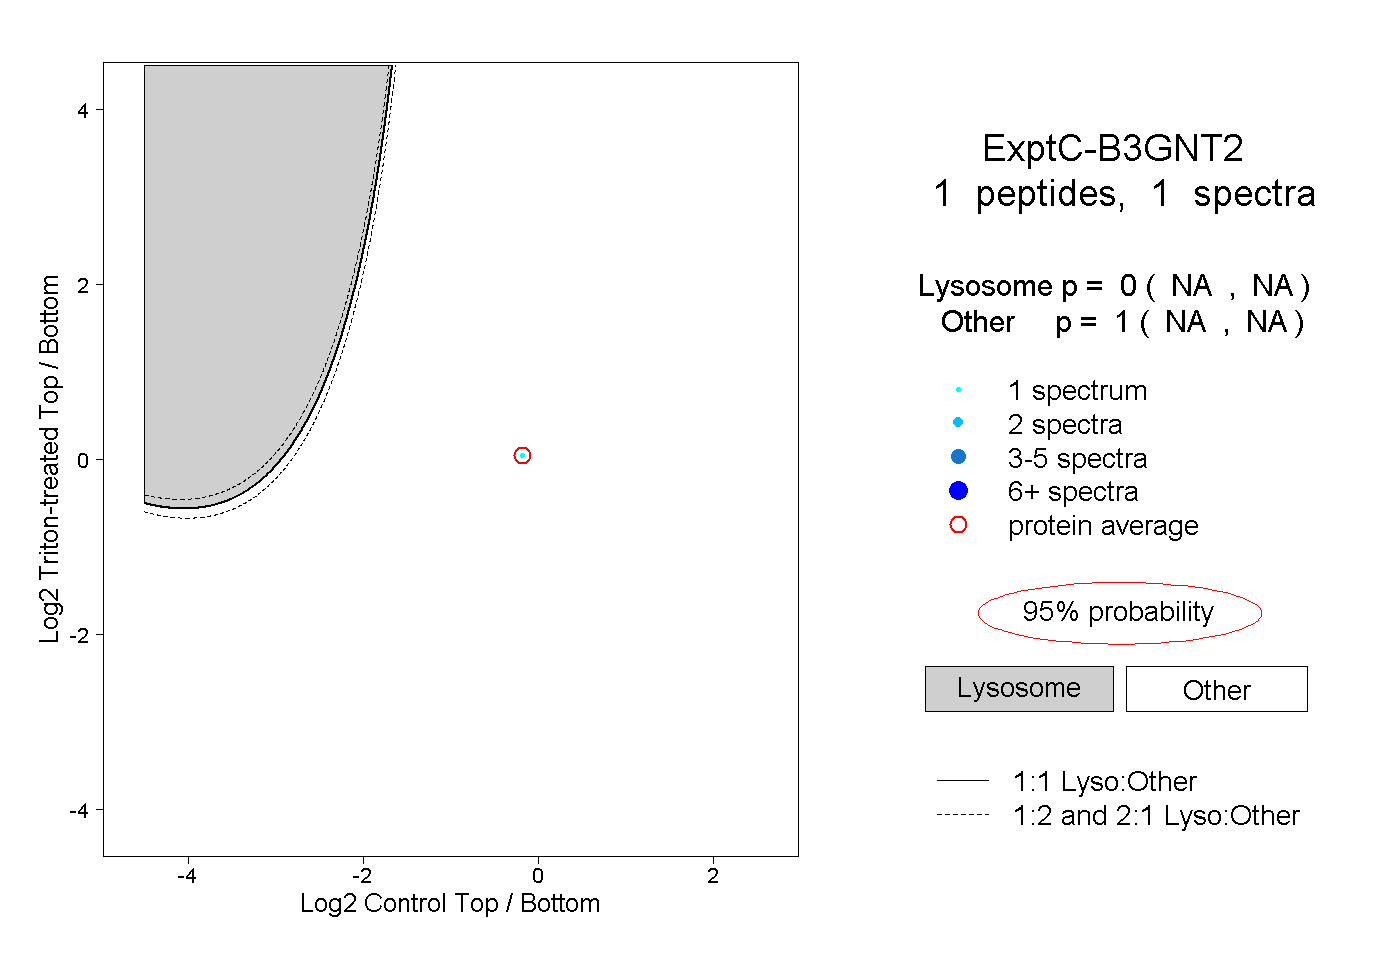 |
0.000 NA | NA |
1.000 NA | NA |