 2
2peptides
spectra
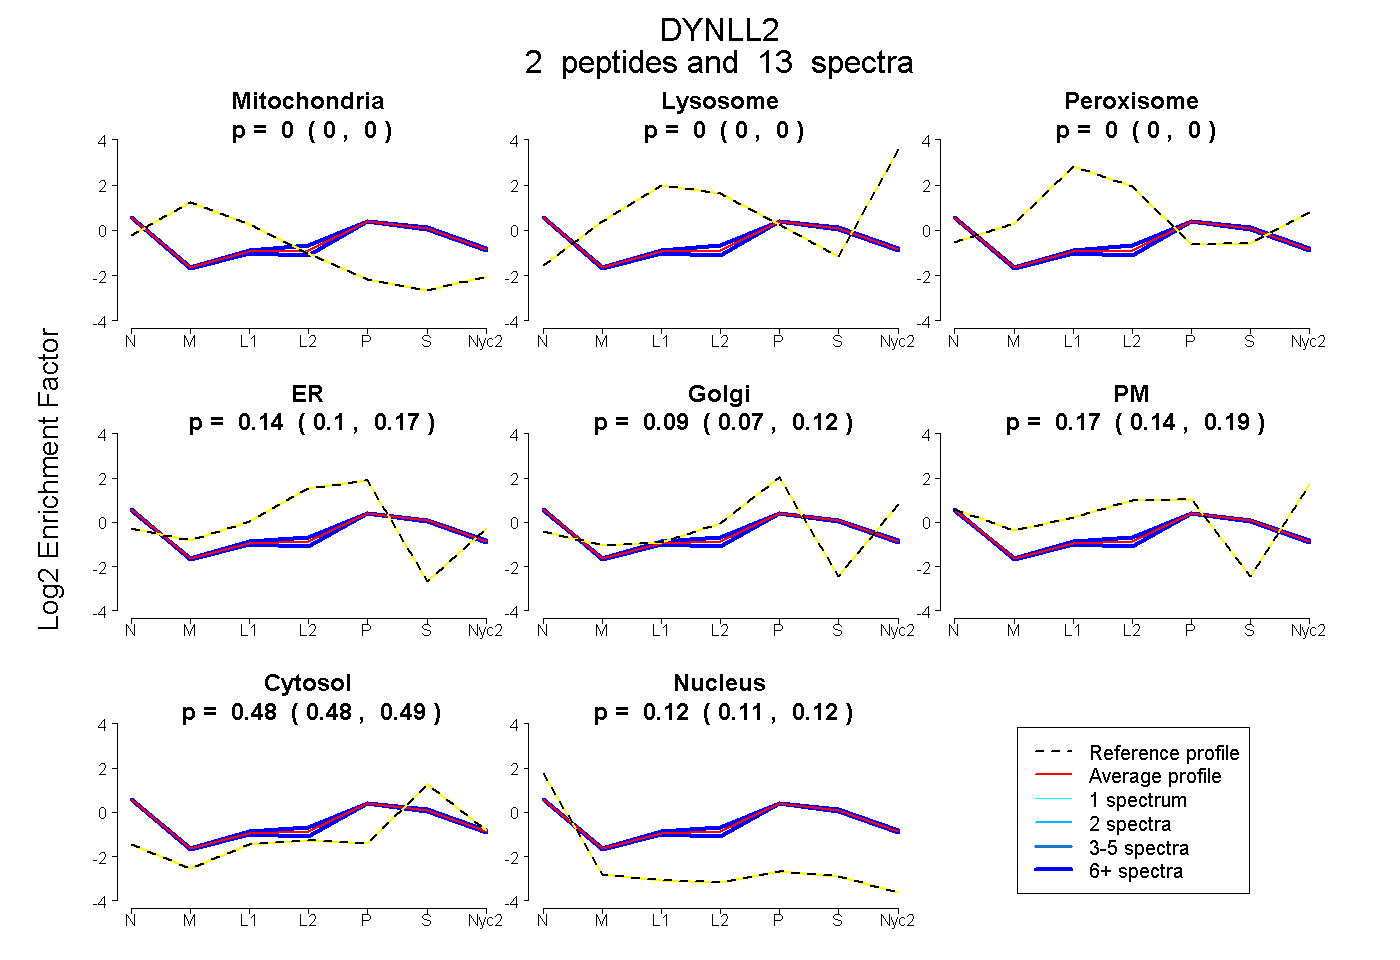
0.000 | 0.000
0.000 | 0.000
0.000 | 0.000
0.104 | 0.165
0.066 | 0.117
0.145 | 0.189
0.475 | 0.486
0.114 | 0.125
2peptides
spectra
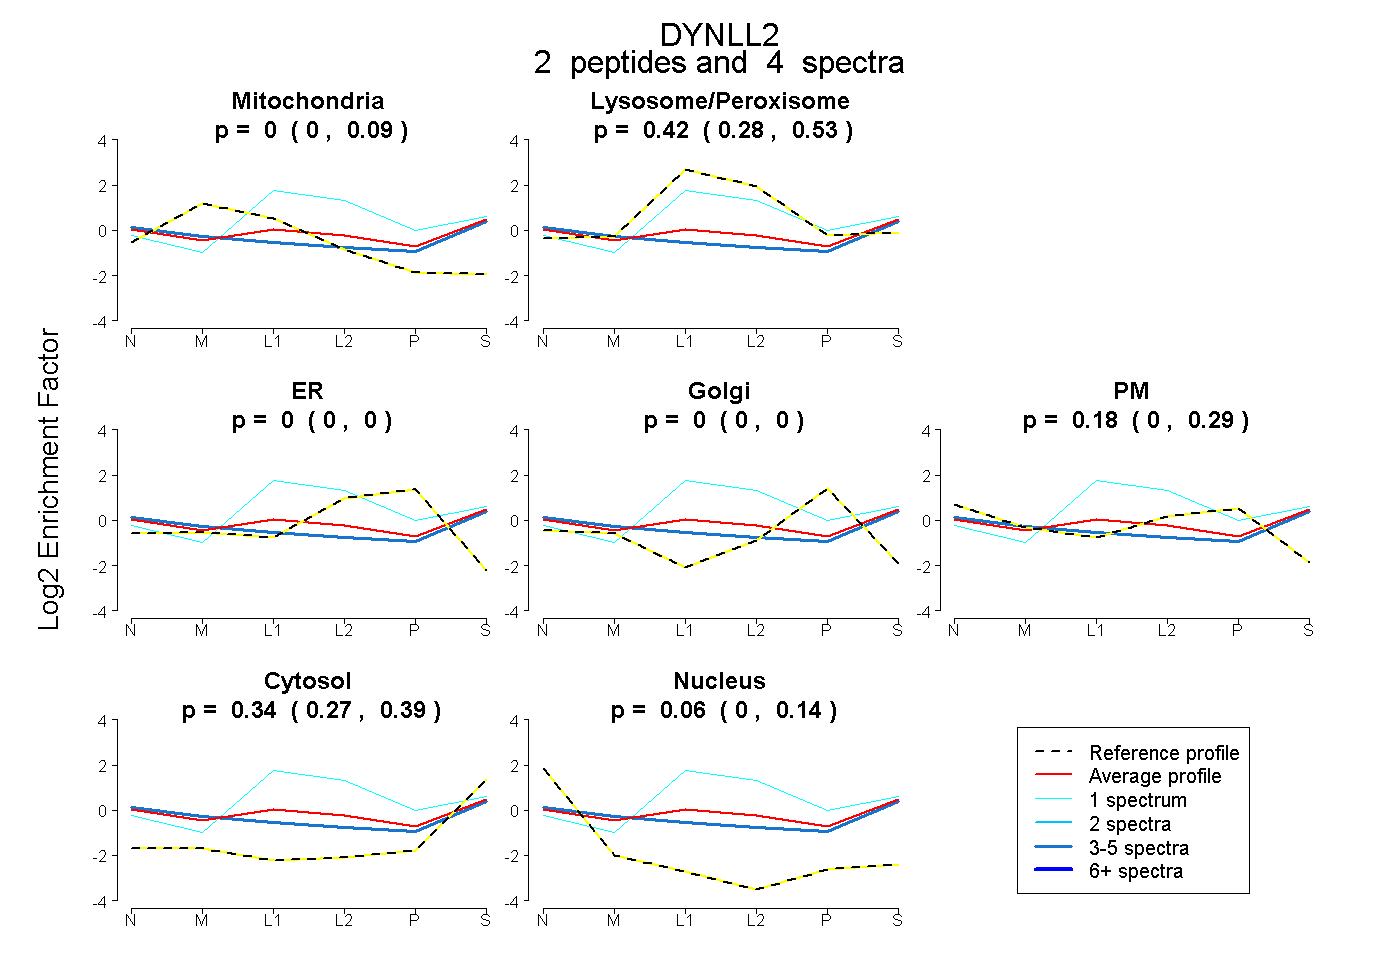
0.000 | 0.090
0.284 | 0.529
0.000 | 0.000
0.000 | 0.000
0.000 | 0.292
0.274 | 0.393
0.000 | 0.139
1peptide
spectra
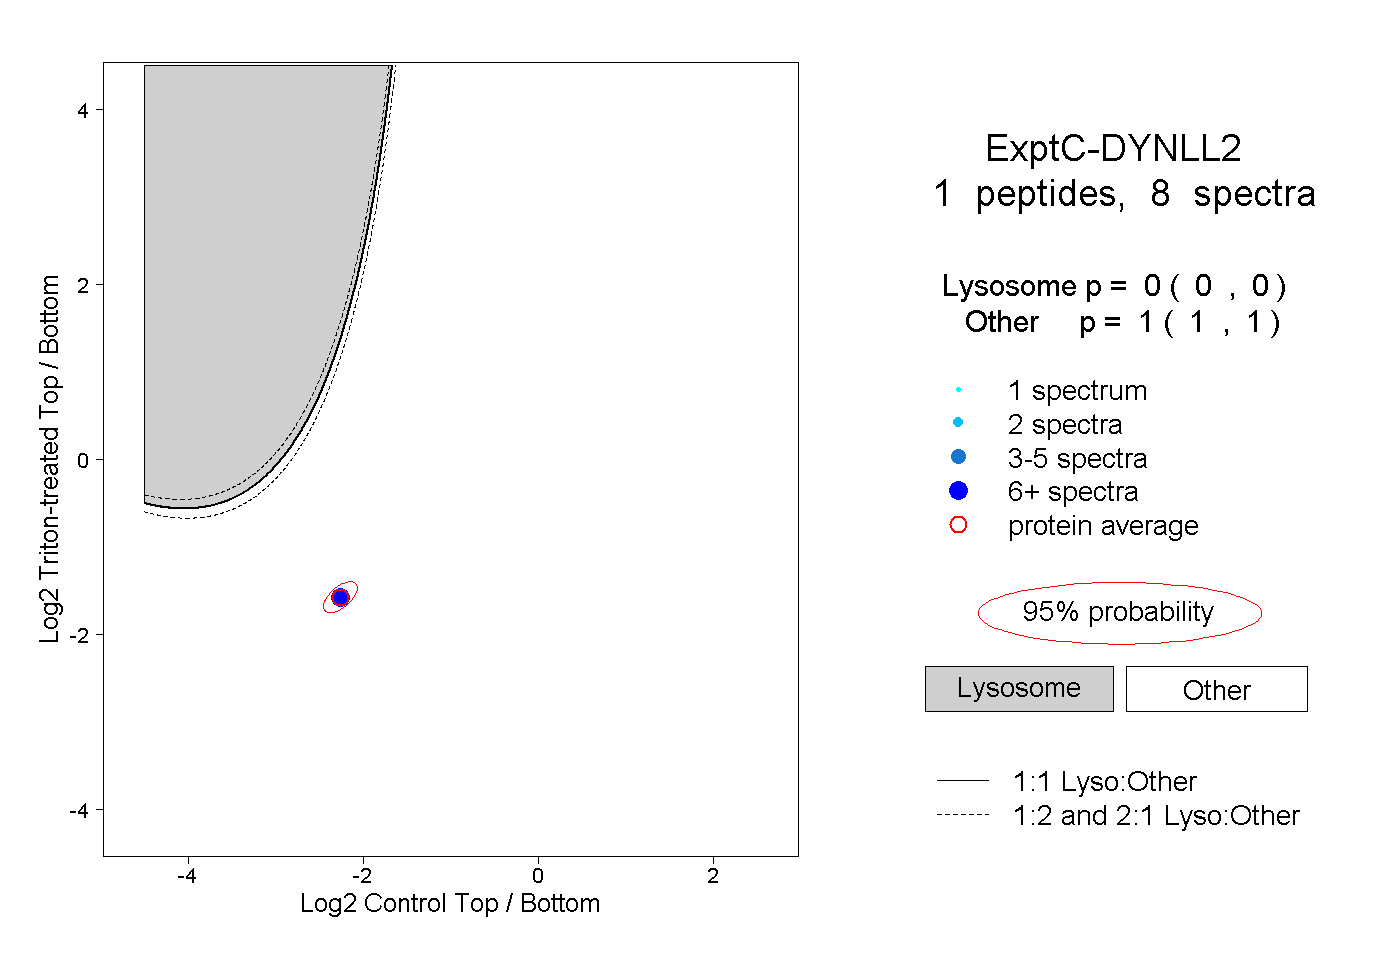
0.000 | 0.000
1.000 | 1.000
1peptide
spectrum
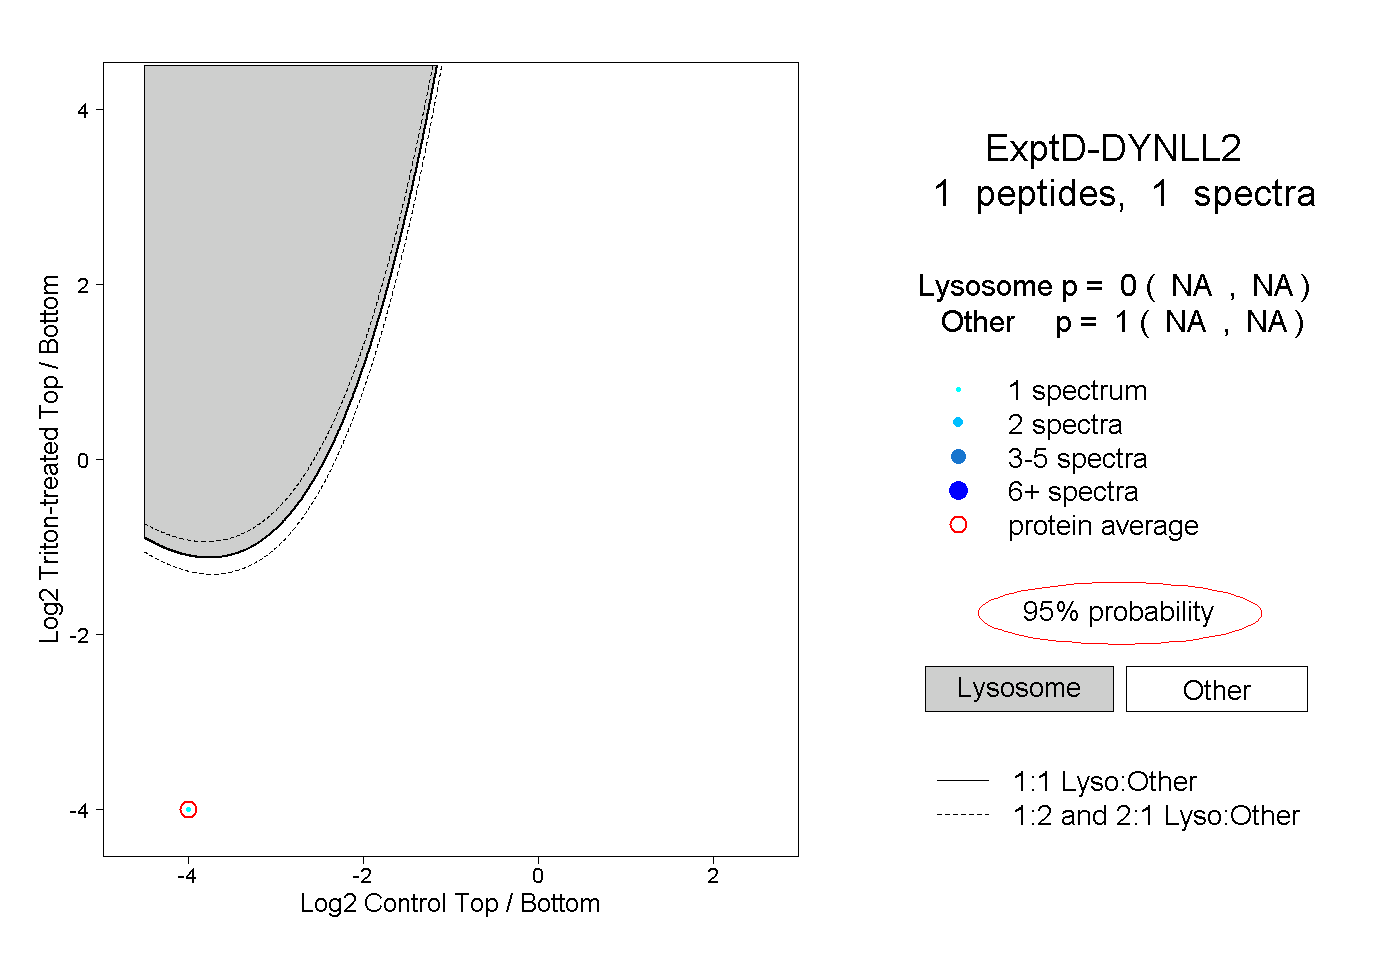
NA | NA
NA | NA