 14
14peptides
spectra
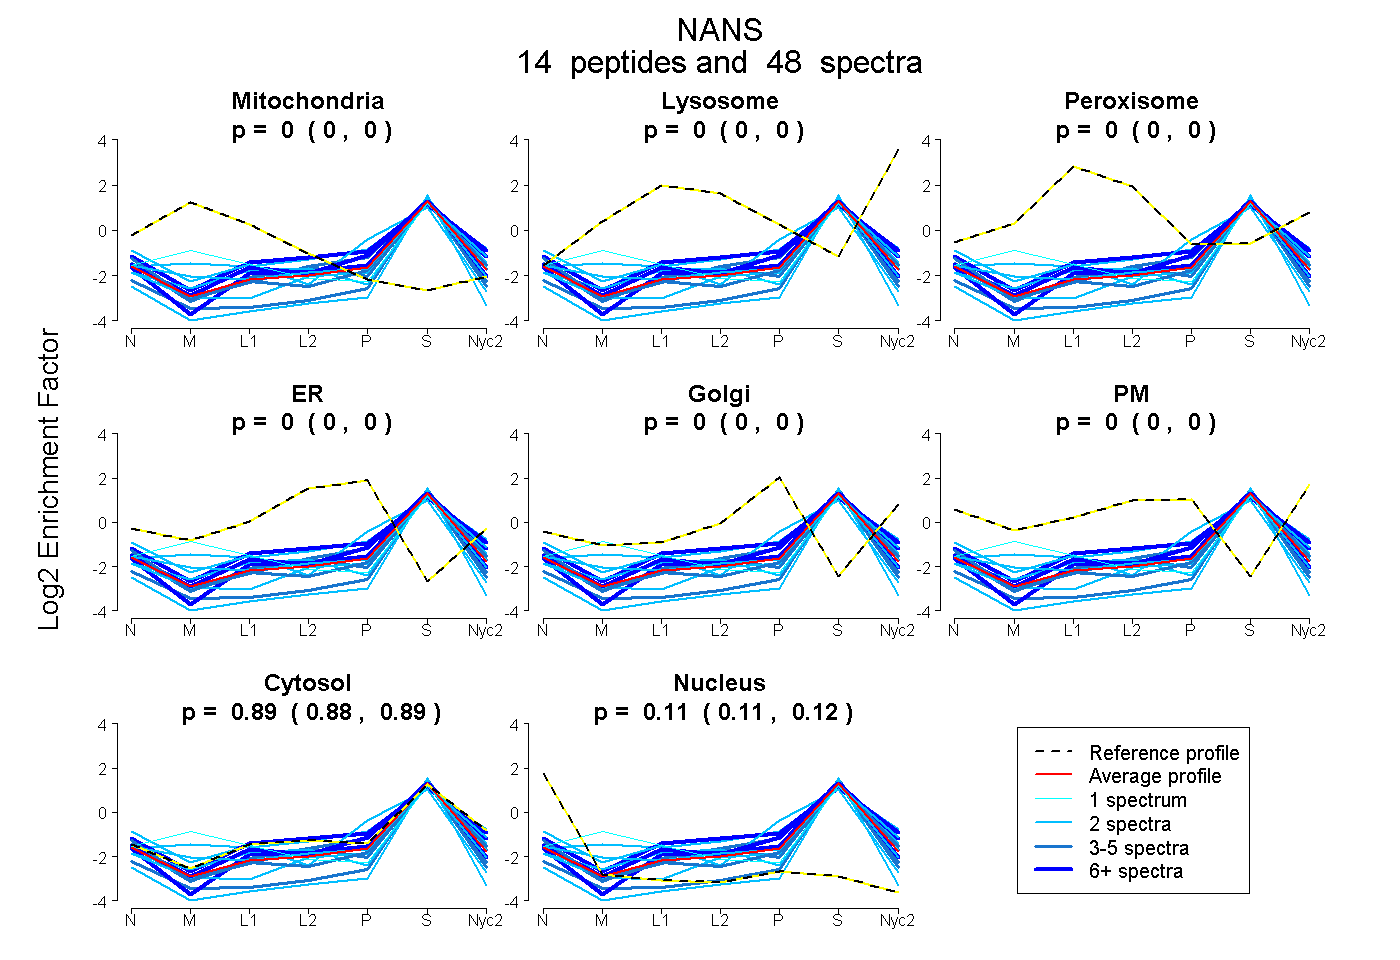
0.000 | 0.000
0.000 | 0.000
0.000 | 0.000
0.000 | 0.000
0.000 | 0.000
0.000 | 0.000
0.881 | 0.892
0.108 | 0.118
6peptides
spectra
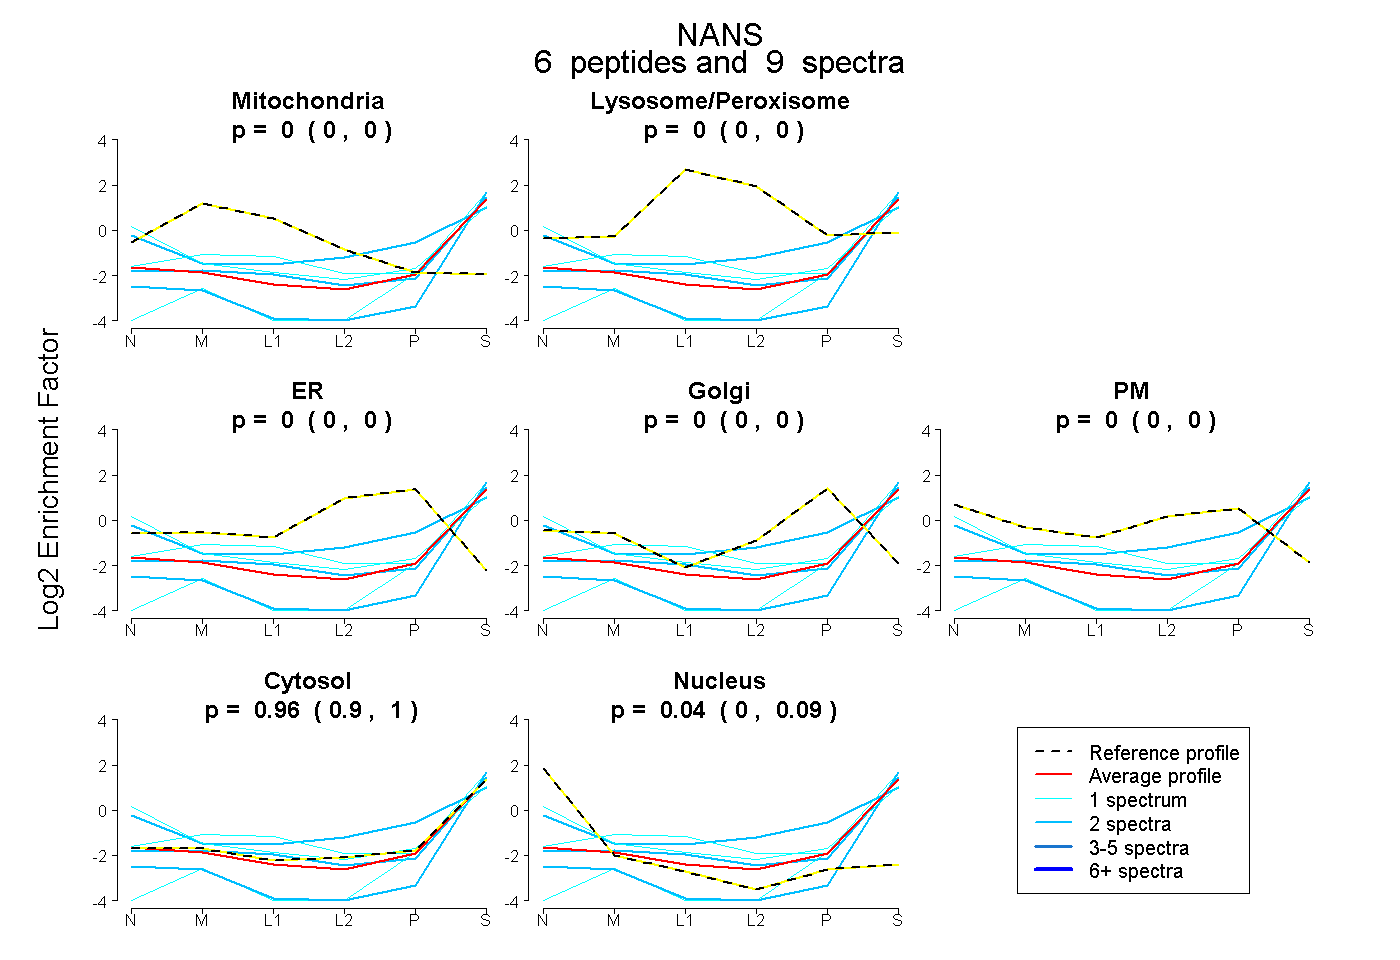
0.000 | 0.000
0.000 | 0.000
0.000 | 0.000
0.000 | 0.000
0.000 | 0.000
0.904 | 1.000
0.000 | 0.085
10peptides
spectra
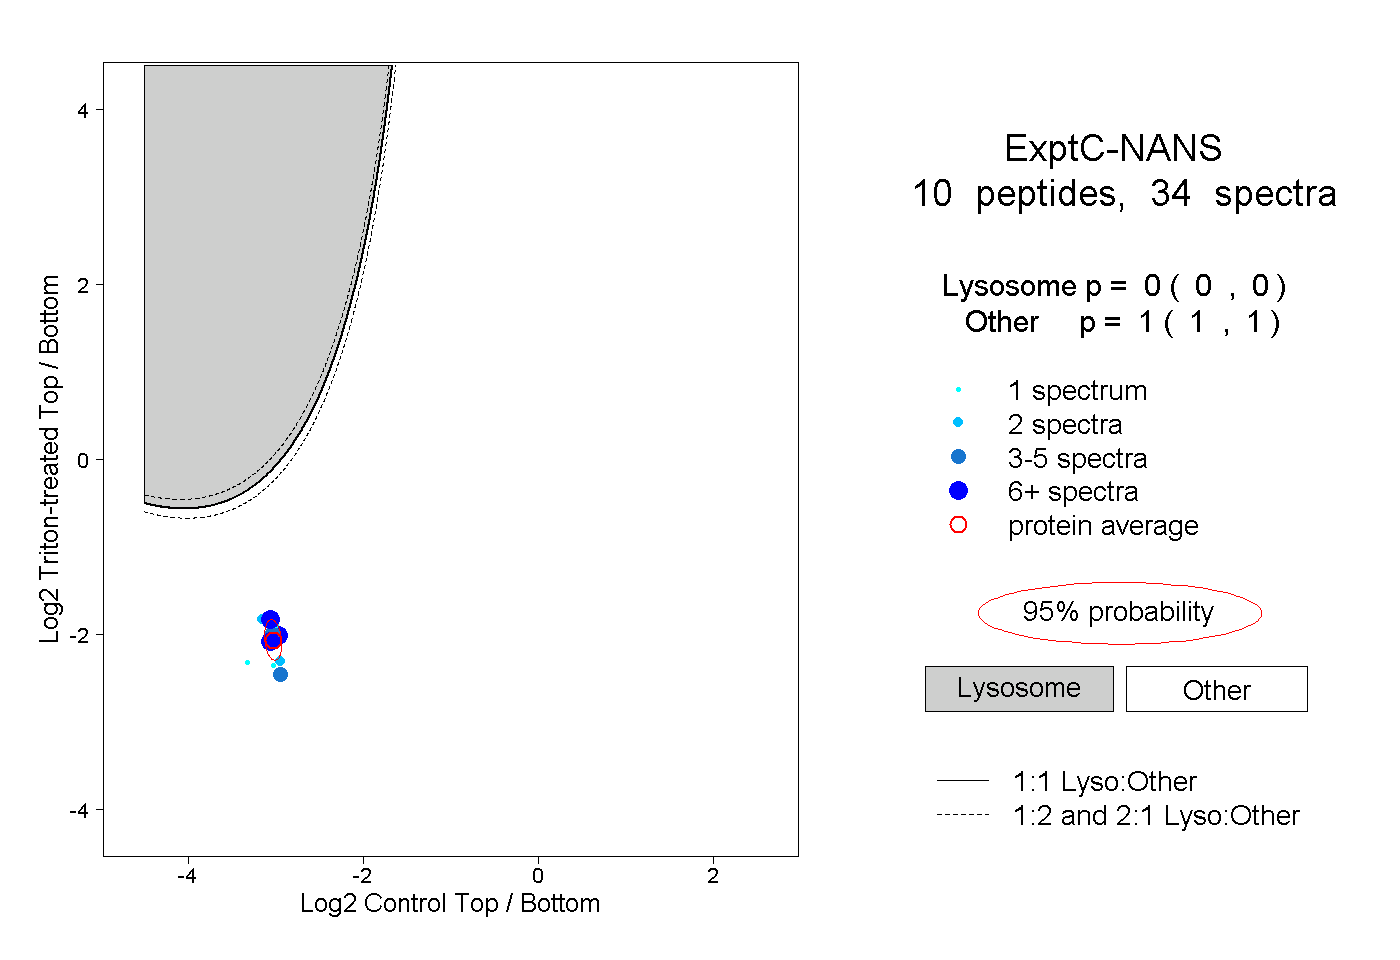
0.000 | 0.000
1.000 | 1.000