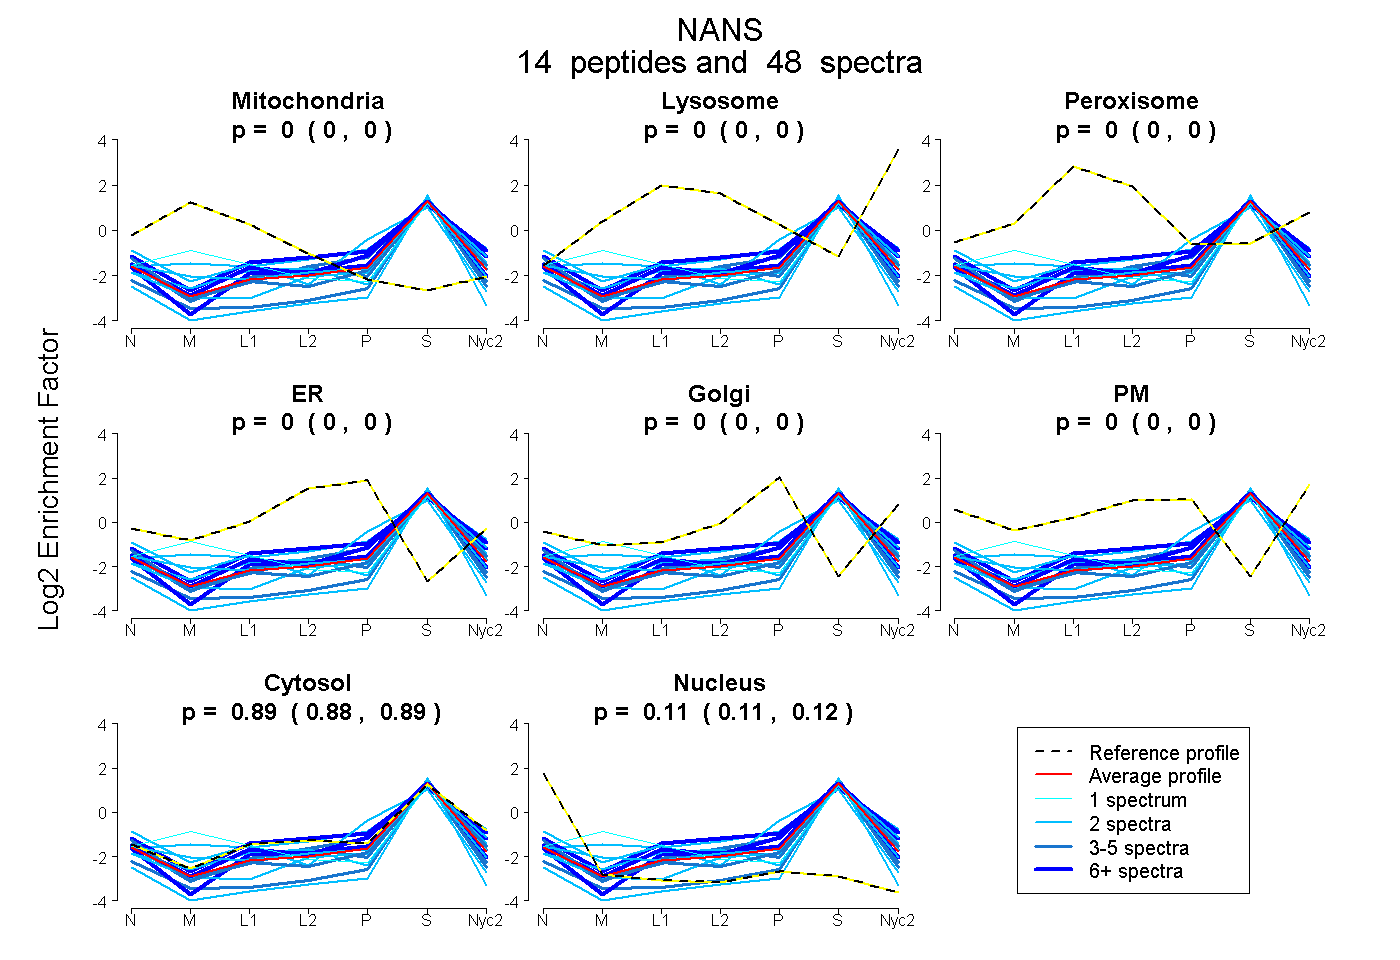
 14
14peptides
spectra
0.000 | 0.000
0.000 | 0.000
0.000 | 0.000
0.000 | 0.000
0.000 | 0.000
0.000 | 0.000
0.881 | 0.892
0.108 | 0.118
| Plot | Mito | Lyso | Perox | ER | Golgi | PM | Cytosol | Nucleus | |||||
| Expt A |
14 peptides |
48 spectra |
|
0.000 0.000 | 0.000 |
0.000 0.000 | 0.000 |
0.000 0.000 | 0.000 |
0.000 0.000 | 0.000 |
0.000 0.000 | 0.000 |
0.000 0.000 | 0.000 |
0.887 0.881 | 0.892 |
0.113 0.108 | 0.118 |
| 2 spectra, GSDHLASLEPGELAELVR | 0.000 | 0.000 | 0.000 | 0.000 | 0.000 | 0.000 | 0.793 | 0.207 | ||
| 2 spectra, ALGSPAK | 0.066 | 0.007 | 0.000 | 0.000 | 0.074 | 0.000 | 0.852 | 0.000 | ||
| 2 spectra, IPAGTILTLDMLTVK | 0.000 | 0.000 | 0.000 | 0.000 | 0.000 | 0.000 | 0.722 | 0.278 | ||
| 6 spectra, QLLPCEMACNEK | 0.000 | 0.000 | 0.000 | 0.000 | 0.000 | 0.000 | 0.957 | 0.043 | ||
| 4 spectra, ECGADCAK | 0.000 | 0.000 | 0.000 | 0.000 | 0.000 | 0.000 | 0.844 | 0.156 | ||
| 2 spectra, PLELELCPGR | 0.000 | 0.000 | 0.000 | 0.000 | 0.000 | 0.000 | 0.898 | 0.102 | ||
| 8 spectra, GRPMVISSGMQSMDTMK | 0.000 | 0.000 | 0.000 | 0.028 | 0.029 | 0.000 | 0.931 | 0.011 | ||
| 6 spectra, HITLDK | 0.000 | 0.000 | 0.000 | 0.000 | 0.000 | 0.000 | 0.894 | 0.106 | ||
| 1 spectrum, VISEYQK | 0.213 | 0.000 | 0.000 | 0.000 | 0.000 | 0.000 | 0.779 | 0.008 | ||
| 3 spectra, ALERPYTSK | 0.000 | 0.000 | 0.000 | 0.000 | 0.000 | 0.000 | 0.905 | 0.095 | ||
| 5 spectra, GYPPEDIFNLVGK | 0.000 | 0.000 | 0.000 | 0.000 | 0.000 | 0.000 | 0.789 | 0.211 | ||
| 2 spectra, HLEFSHDQYK | 0.000 | 0.000 | 0.000 | 0.000 | 0.000 | 0.000 | 0.894 | 0.106 | ||
| 3 spectra, SELEFK | 0.000 | 0.000 | 0.000 | 0.000 | 0.000 | 0.000 | 0.847 | 0.153 | ||
| 2 spectra, VGSGDTNNFPYLEK | 0.000 | 0.000 | 0.000 | 0.000 | 0.000 | 0.000 | 0.924 | 0.076 |
| Plot | Mito | Lyso or Perox | ER | Golgi | PM | Cytosol | Nucleus | ||||||
| Expt B |
6 peptides |
9 spectra |
 |
0.000 0.000 | 0.000 |
0.000 0.000 | 0.000 |
0.000 0.000 | 0.000 |
0.000 0.000 | 0.000 |
0.000 0.000 | 0.000 |
0.960 0.904 | 1.000 |
0.040 0.000 | 0.085 |
|||
| Plot | Lyso | Other | |||||||||||
| Expt C |
10 peptides |
34 spectra |
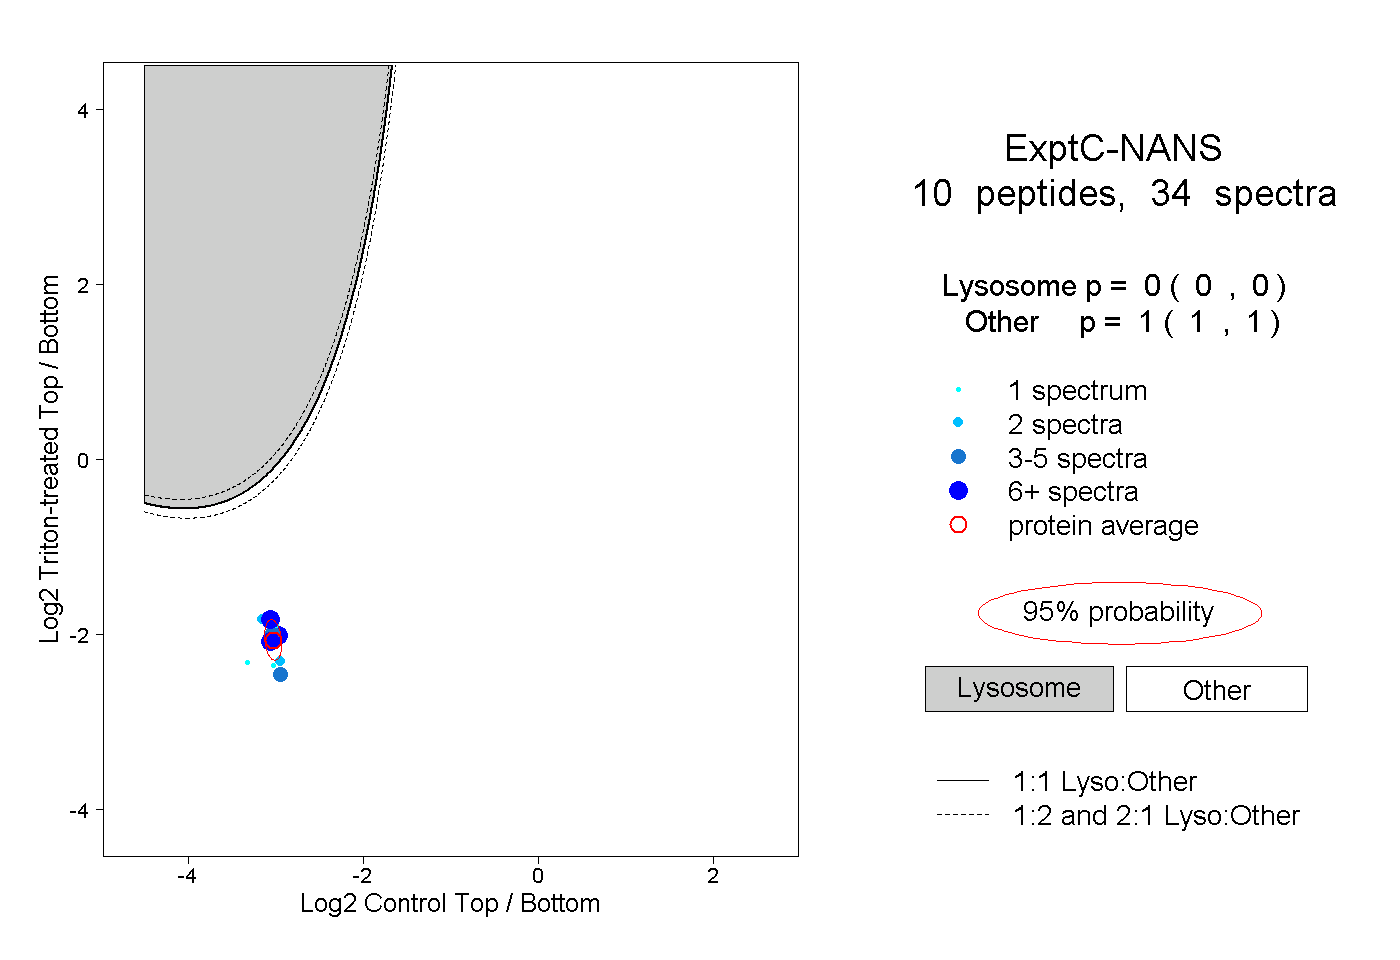 |
0.000 0.000 | 0.000 |
1.000 1.000 | 1.000 |