 3
3peptides
spectra
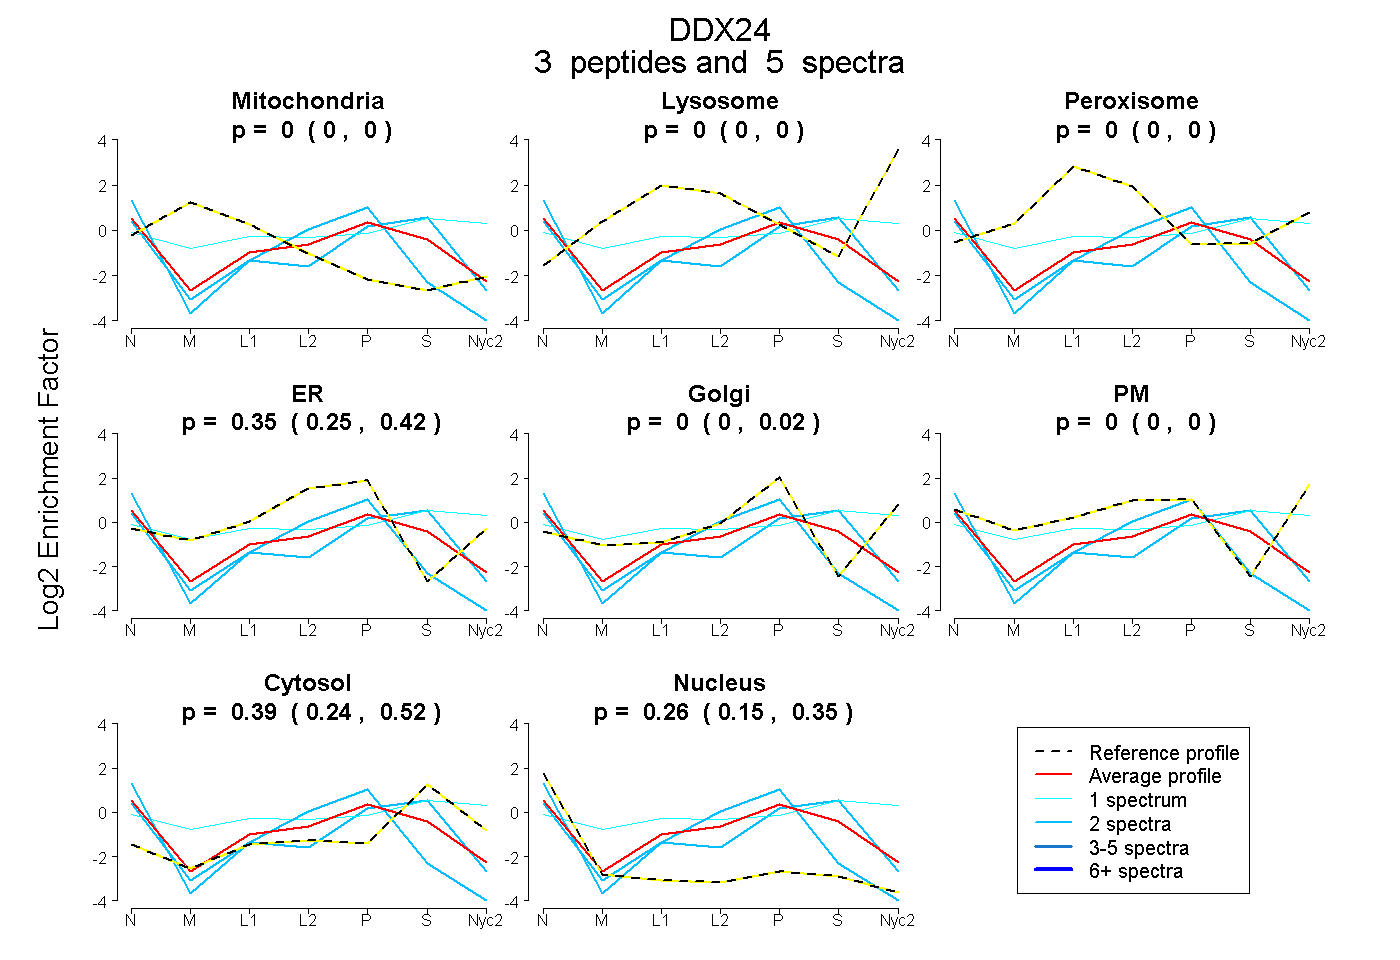
0.000 | 0.000
0.000 | 0.000
0.000 | 0.000
0.247 | 0.424
0.000 | 0.018
0.000 | 0.000
0.238 | 0.517
0.149 | 0.349
1peptide
spectrum
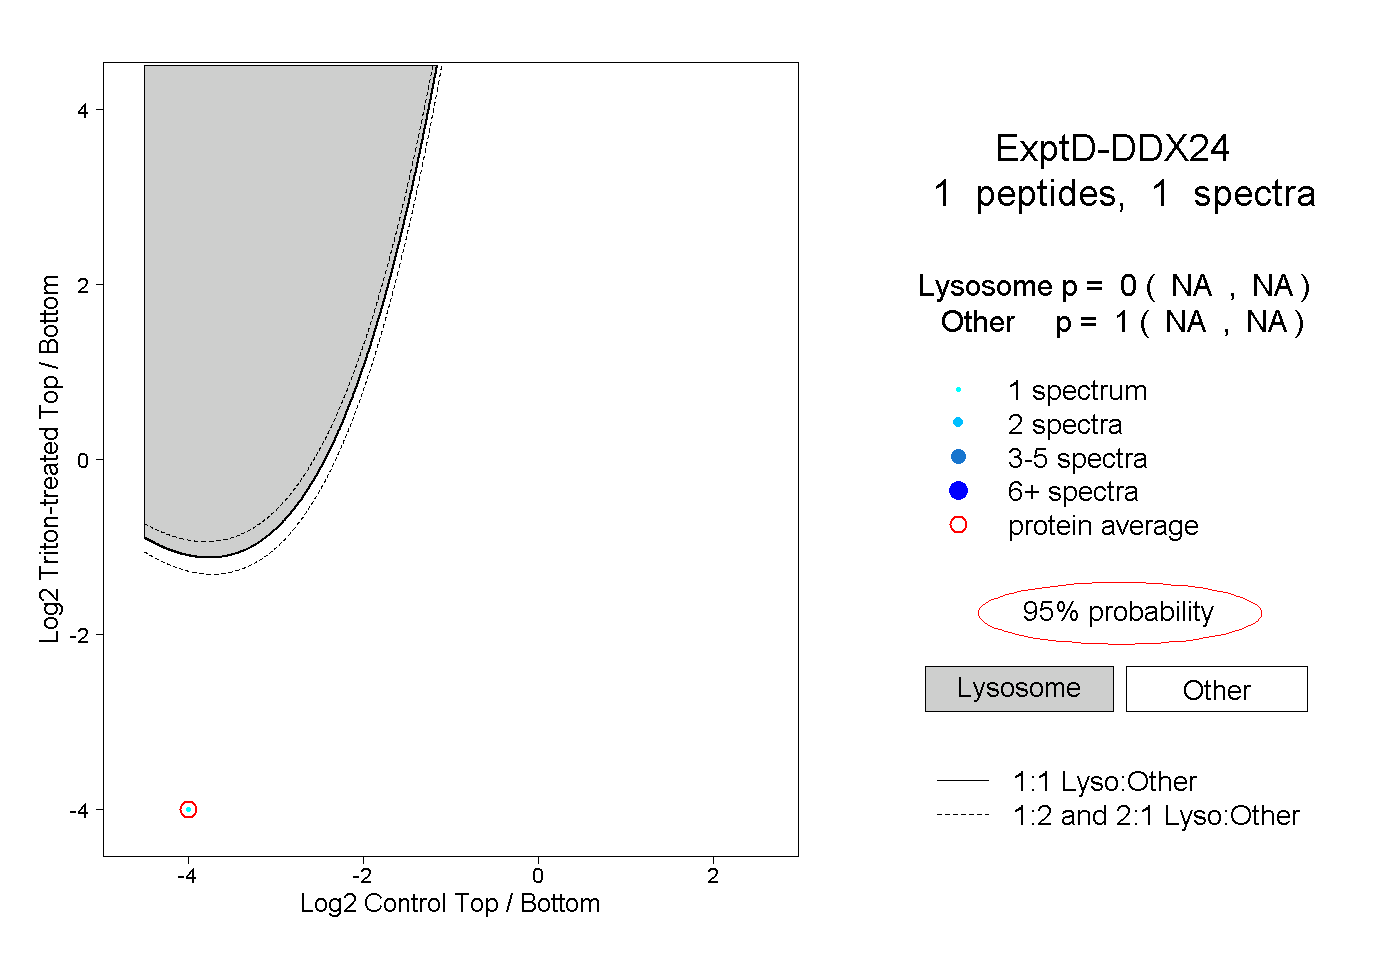
NA | NA
NA | NA
| Plot | Mito | Lyso | Perox | ER | Golgi | PM | Cytosol | Nucleus | |||||
| Expt A |
3 peptides |
5 spectra |
|
0.000 0.000 | 0.000 |
0.000 0.000 | 0.000 |
0.000 0.000 | 0.000 |
0.354 0.247 | 0.424 |
0.000 0.000 | 0.018 |
0.000 0.000 | 0.000 |
0.390 0.238 | 0.517 |
0.257 0.149 | 0.349 |
||
| Plot | Lyso | Other | |||||||||||
| Expt D |
1 peptide |
1 spectrum |
|
0.000 NA | NA |
1.000 NA | NA |