DAD1
[ENSRNOP00000012233]
Main page
| | | Plot |
Mito |
Lyso |
|
Perox |
ER |
Golgi |
PM |
Cytosol |
Nucleus |
|
| Expt A |
 4
4
peptides |
32
spectra |
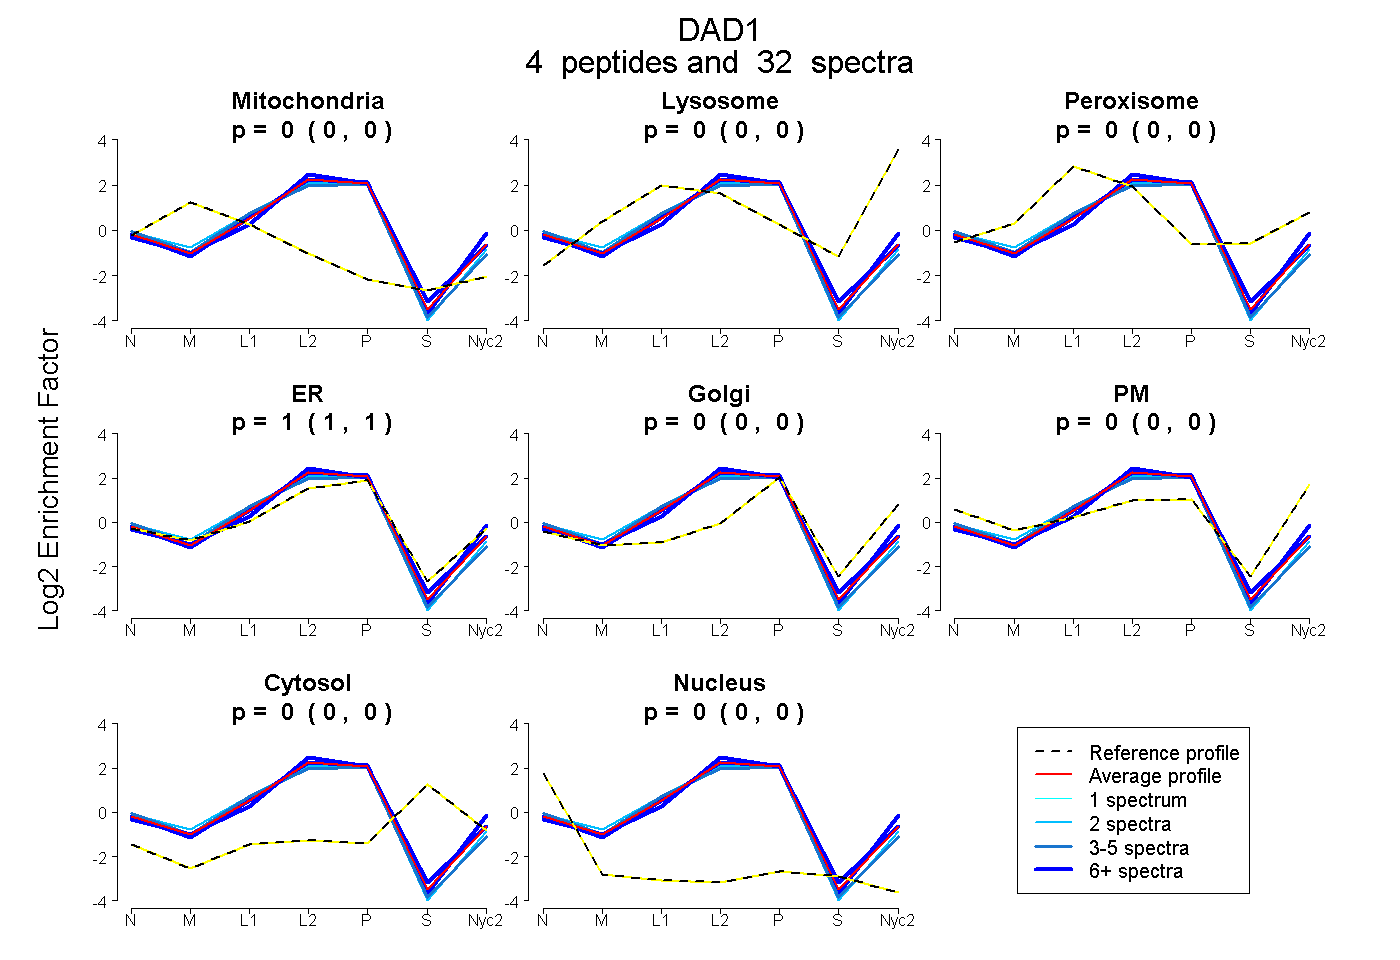 |
0.000
0.000 | 0.000 |
0.000
0.000 | 0.000 |
|
0.000
0.000 | 0.000 |
1.000
1.000 | 1.000 |
0.000
0.000 | 0.000 |
0.000
0.000 | 0.000 |
0.000
0.000 | 0.000 |
0.000
0.000 | 0.000 |
|
| | | Plot |
Mito |
|
Lyso or Perox |
|
ER |
Golgi |
PM |
Cytosol |
Nucleus |
|
| Expt B |
3
peptides |
19
spectra |
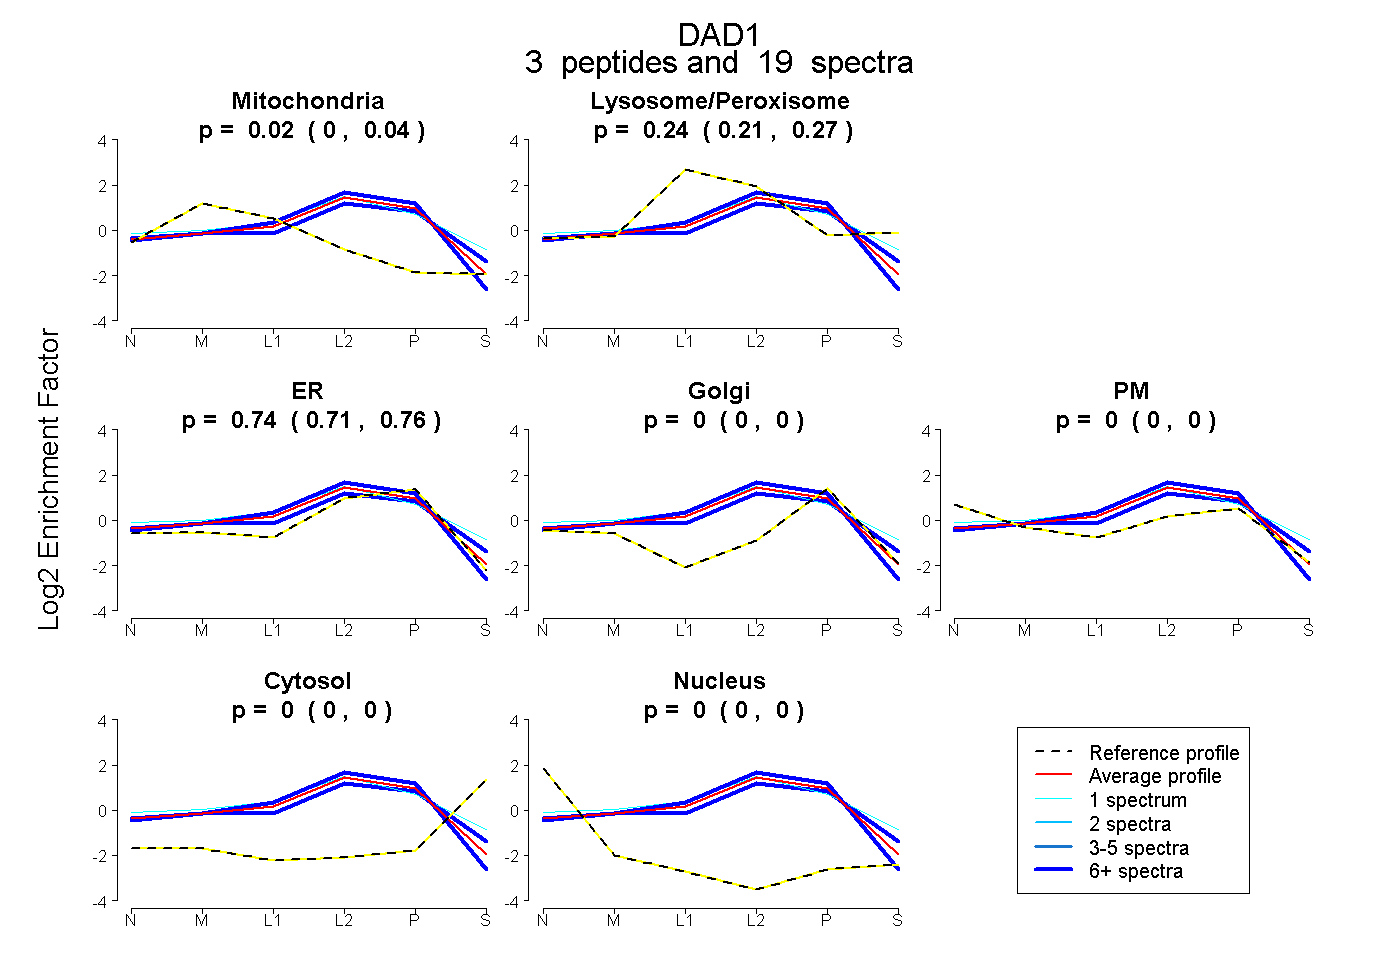 |
0.018
0.000 | 0.036 |
|
0.243
0.207 | 0.271 |
|
0.739
0.707 | 0.762 |
0.000
0.000 | 0.000 |
0.000
0.000 | 0.002 |
0.000
0.000 | 0.000 |
0.000
0.000 | 0.000 |
|
| 1 spectrum, IQINPQNK |
0.000 |
|
0.415 |
|
0.379 |
0.000 |
0.203 |
0.003 |
0.000 |
|
| 11 spectra, SASVVSVISR |
0.000 |
|
0.204 |
|
0.796 |
0.000 |
0.000 |
0.000 |
0.000 |
|
| 7 spectra, ADFQGISPER |
0.005 |
|
0.240 |
|
0.593 |
0.000 |
0.143 |
0.019 |
0.000 |
|
| | | Plot |
|
Lyso |
|
|
|
|
|
|
|
Other |
| Expt C |
4
peptides |
35
spectra |
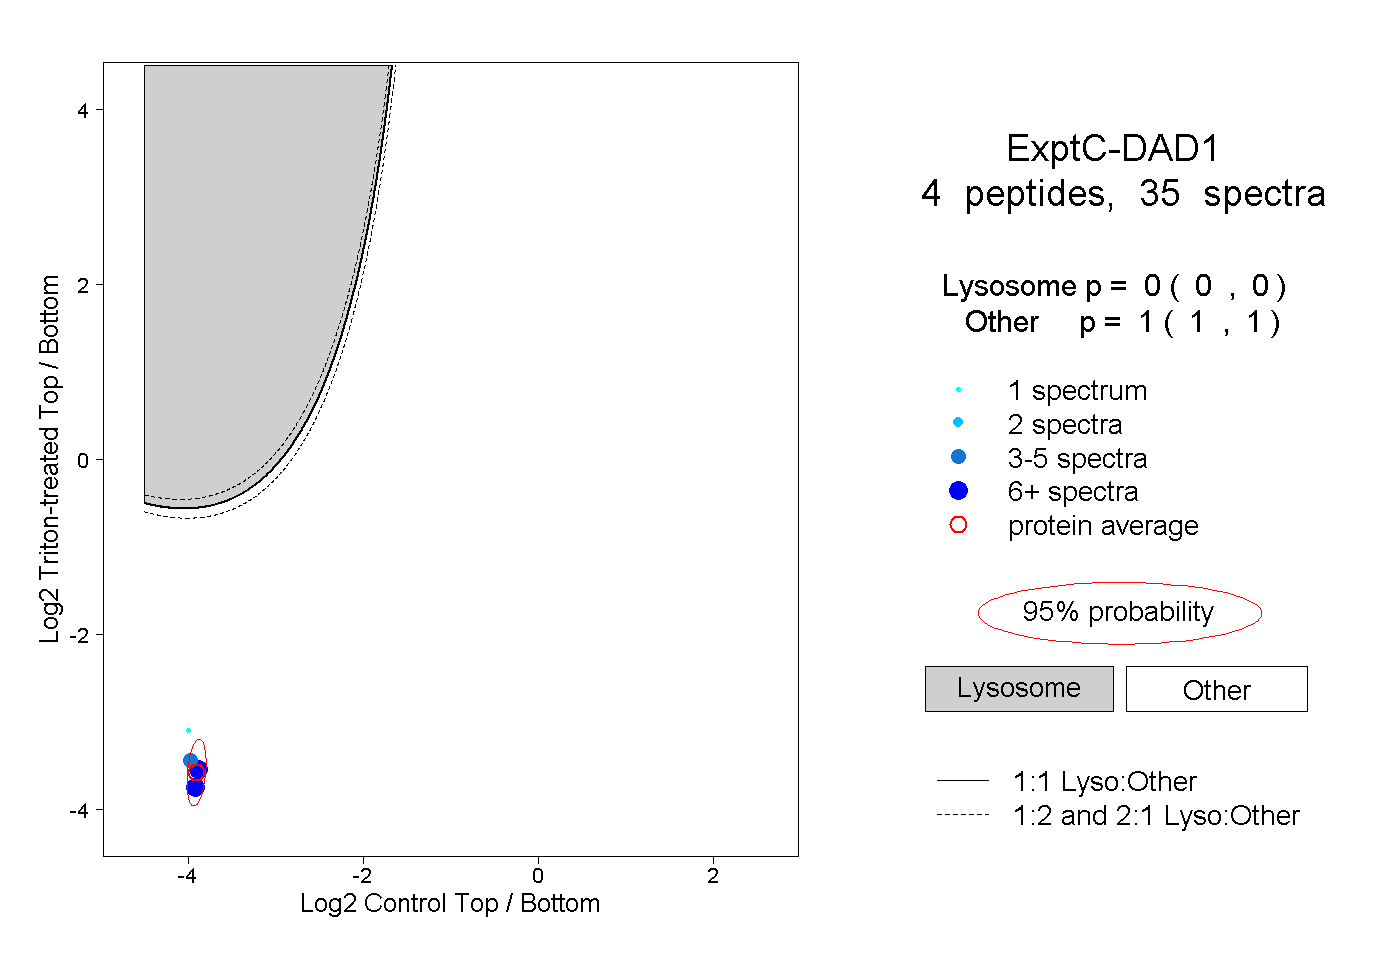 |
|
0.000
0.000 | 0.000 |
|
|
|
|
|
|
|
1.000
1.000 | 1.000 |
| | | Plot |
|
Lyso |
|
|
|
|
|
|
|
Other |
| Expt D |
4
peptides |
11
spectra |
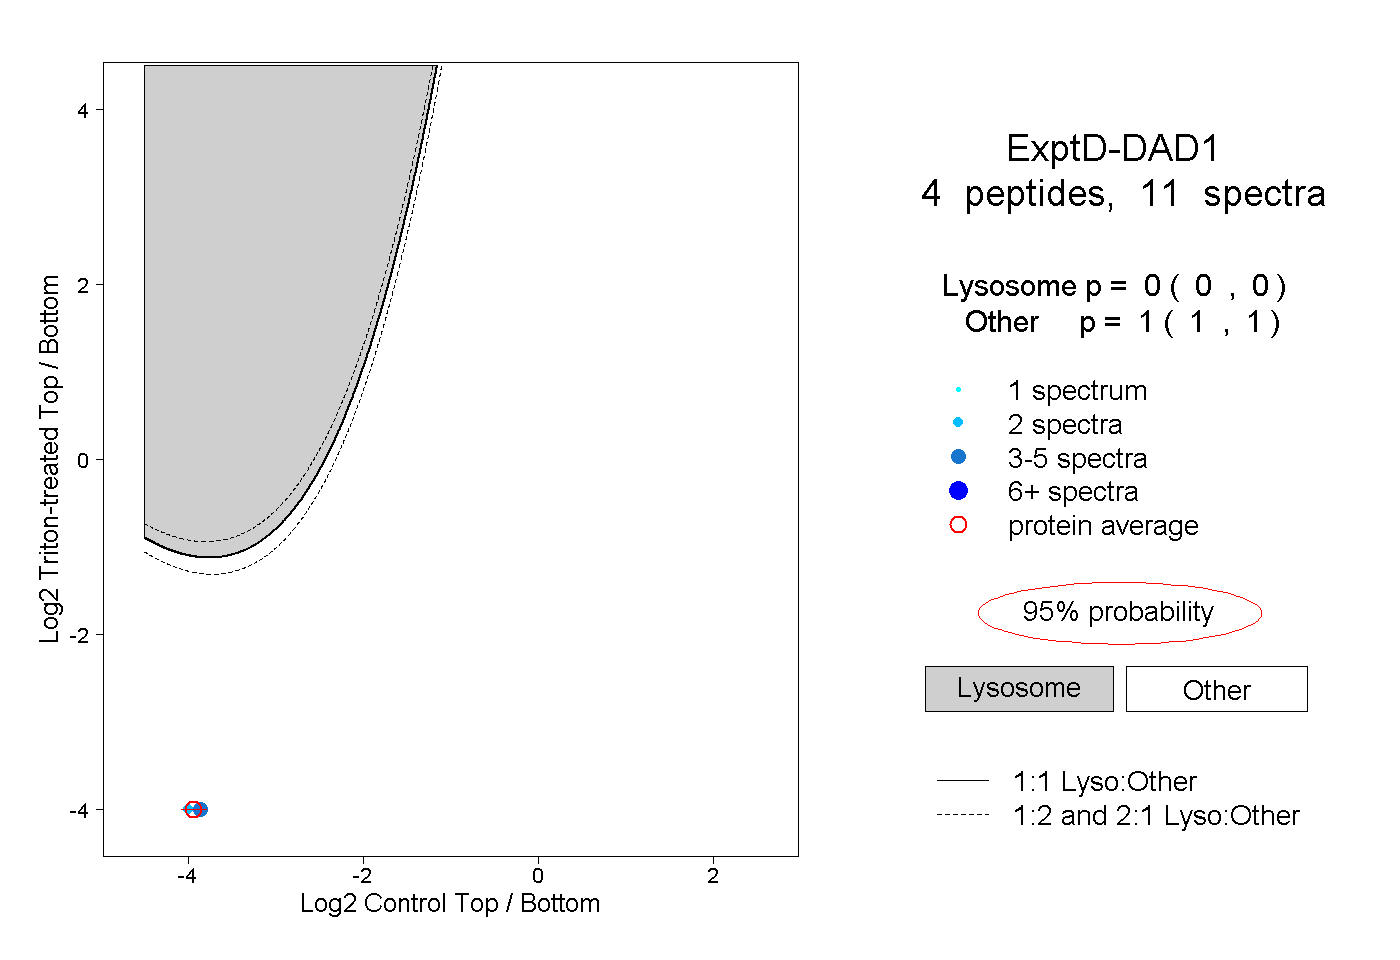 |
|
0.000
0.000 | 0.000 |
|
|
|
|
|
|
|
1.000
1.000 | 1.000 |